
Building a machine learning model that can predict and analyze future hurricanes.
In the country, I live we really experience any hurricanes. After finishing high school I found a university in Houston Texas and decided to continue my education there. My first impression of Texas was not what I was expecting. Meaning no cowboys with hats. Unfortunately, there was one more thing I wasn’t expecting at all…..hurricanes. It was late summer of 2017 when hurricane Harvey hit Houston and it hit it hard. I was living in a dorm at that time. Dying from boredom I decided to find something to do. I started working on building a machine learning model that can predict and analyze future hurricanes.
In this project, we will use the Jupiter notebook and for the dataset, it will be atlantic.csv, which can be found on the official government website.
First, let’s import libraries
import pandas as pd
import numpy as np
import matplotlib.pyplot as plt
import random
import seaborn as sns
from fbprophet import Prophet
from datetime import datetime
After, we need to load a dataset.
dataset_df = pd.read_csv(‘atlantic.csv’,error_bad_lines=False)
#This dataset consists not only of the hurricanes but tsunamis and other catastrophes.

After closely analyzing the dataset we need to drop unnecessary columns
dataset_df.drop([‘ID’,’Name’, ‘Time’ , ‘Event’ , ‘Latitude’, ‘Maximum Wind’, ‘Minimum Pressure’,’Low Wind SW’, ‘Low Wind NW’, ‘Moderate Wind NE’, ‘Moderate Wind SE’, ‘Moderate Wind SW’, ‘Moderate Wind NW’ , ‘High Wind NE’, ‘High Wind SE’, ‘High Wind SW’, ‘High Wind NW’ ,’Longitude’ , ‘Low Wind NE’ ,’Low Wind SE’], inplace=True ,axis = 1)
We will be using Facebook Prophet to make predictions. Since it is a time-series database we need to adjust it’s format a little bit.
dataset_df[‘Date’]=pd.to_datetime(dataset_df[‘Date’].astype(str), format=’%Y/%m/%d’)
dataset_df[‘Date’] = dataset_df[“Date”].apply(str)
type(dataset_df[“Date”][0])
You should be able to see something like this.

dataset_df[‘Status’].value_counts()
Let’s plot some graphs.
plt.figure(figsize=(15,10))
sns.countplot(y = ‘Status’ , data = dataset_df, order = dataset_df[‘Status’].value_counts().iloc[:15].index)

Top 4 Most Popular Ai Articles:
3. Real vs Fake Tweet Detection using a BERT Transformer Model in few lines of code
As you notice, tsunamis happen more frequently than hurricanes.
dataset_df.index = pd.DatetimeIndex(dataset_df.Date)
Let’s resample it by month and plot a different graph.
dataset_df.resample(‘M’).size()
plt.plot(dataset_df.resample(‘Y’).size())
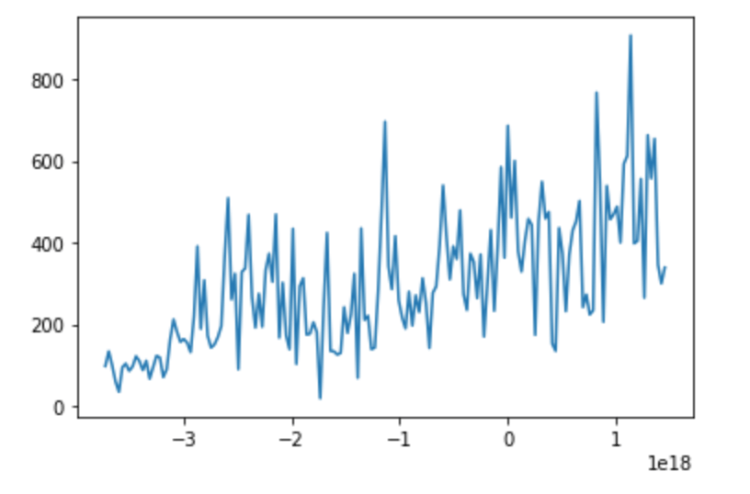
Let’s resample it, but now reset the index
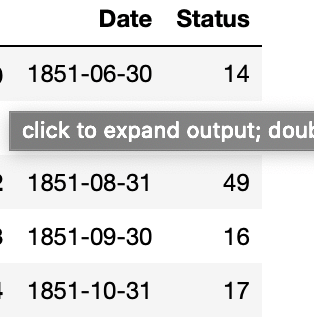
dataset_prophet = dataset_df.resample(‘M’).size().reset_index()
Right now the columns show Date and 0. I will change it to something that makes more sense.

dataset_prophet.columns = [‘Date’,’Status’]
Perfect! Now it has much better names.
Now we need to convert it to the format that facebook prophet accepts.
dataset_prophet = pd.DataFrame(dataset_prophet)
dataset_prophet_final = dataset_prophet.rename(columns = {‘Date’: ‘ds’, ‘Status’:’y’})
Next comes training! With 2 lines of code, we can fit our dataset.
m = Prophet()
m.fit(dataset_prophet_final)
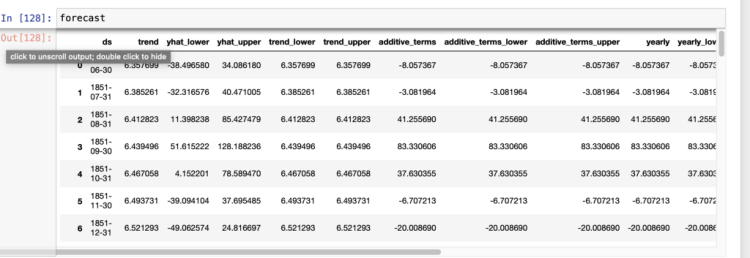
Let’s forecast the future!
future = m.make_future_dataframe(periods=365)
forecast = m.predict(future)
Detailed representation of the output. Some graphs would make it easier to understand.
pd.plotting.register_matplotlib_converters()
m.plot(forecast, xlabel=’Date’, ylabel=’Events’)
I hope you enjoyed it!
Don’t forget to give us your ? !


Hurricane Prediction was originally published in Becoming Human: Artificial Intelligence Magazine on Medium, where people are continuing the conversation by highlighting and responding to this story.
Via https://becominghuman.ai/hurricane-prediction-7077c26405ca?source=rss—-5e5bef33608a—4
source https://365datascience.weebly.com/the-best-data-science-blog-2020/hurricane-prediction
