

Why is my dashboard working so slowly? Everyone must have faced this problem many times. People who are designing dashboards with utmost care will also face this issue.
The first approach we should try after getting to this stage is Performance Recording in Tableau BI Development.
What is Performance Recording?
Tableau happens to give a very nice option for the developers to see all the processes that are happening in the background when you perform an action on your dashboard.
It gives you a dashboard with all the details that you will need to understand the performance of your dashboard and when your dashboard is hitting a steep curve in performance.
Top 4 Most Popular Ai Articles:
1. Natural Language Generation:
The Commercial State of the Art in 2020
4. Becoming a Data Scientist, Data Analyst, Financial Analyst and Research Analyst
So to get the performance recording started for your workbook you have to follow the below steps:
1. First, make a list of actions or the worksheets which are taking more time to load.
2. Open the workbook
Go to Help -> Settings and Performance -> Start Performance Recording
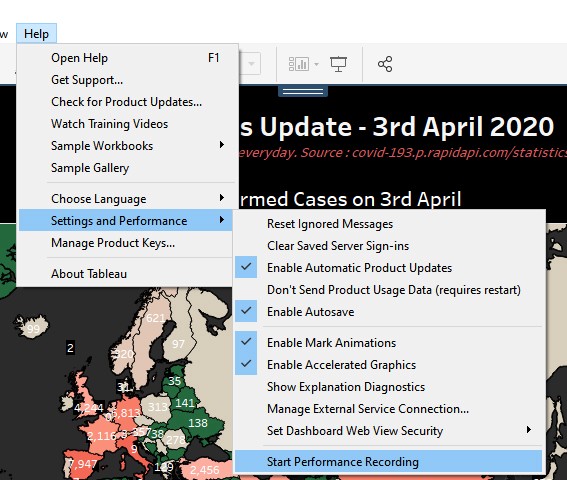
3. Perform the activities that you have listed in step 1.
4. Stop the recording
Go to Help -> Settings and Performance -> Stop Performance Recording

5. Now another workbook named ‘Performance Recording’ will open automatically with below tabs:

Now you have created a performance recording for your tableau workbook. This workbook will let us know about where our workbook is lagging in performance.

So the Performance Summary tab in this workbook will have below information and what does these KPIs mean that we will discuss:
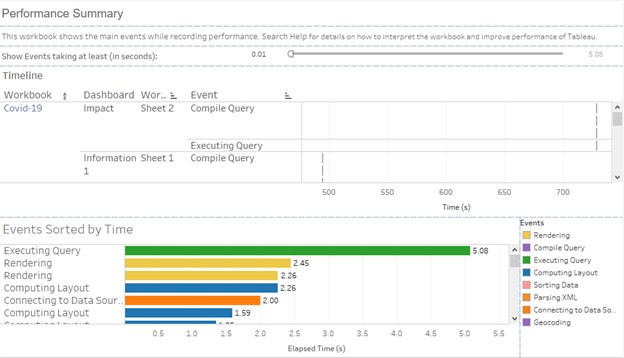
Above is the sample screenshot of a performance recording.
There are 3 sections in this dashboard.
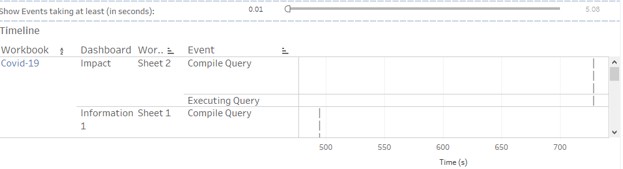
1. Timeline: This view explains the performance for each worksheet and the event occurred for it.
It has 4 fields like Workbook, Dashboard, Worksheet, Event and time taken for the event.
1. Events:
Below are the events that mainly describe what the workbook does in background:
a. Rendering:
Rendering tells you the time taken for the vizQL to load a particular visualization.
b. Compile Query
This is the amount of time spent by Tableau in generating the queries. It depends on the calculations that you have used. If you have many calculated fields and complex LODs or calculations, the compile query time will be high. To reduce this time, you can make your workbook simple and remove some calculated fields.
c. Execution Query
This is the time taken by the data source query to get executed. For a database connection the performance can be improved by adding some performance to your data base or by optimizing your query so that it takes less time. For an extract you might want to remove some columns that you are not using or change some joins or remove some tables which you are not using.
d. Computing Layout
Computing layout is the time taken for visualizing all the layouts. You can reduce the number of views in a particular dashboard to reduce this time.
e. Sorting Data
This is the time taken for the data in your view to get sorted. If you have nested sorting or a large number of items to be sorted or you can have some complex calculations which you are using for sorting the data.
f. Connecting to Data Source
This is the time taken by the tableau to connect to the data source. If you are using a connection to Database, you can check your network speed or you can connect with your data base admin to see if you can improve this.
g. Geocoding
Geocoding is the time taken on the geographical data from your view. If you have a huge number of items using the Geocoding, then your workbook performance will get hampered.
2. Query
IF you try to click on ‘Executing Query’ you will see a query in the Query tab on the same summary dashboard.
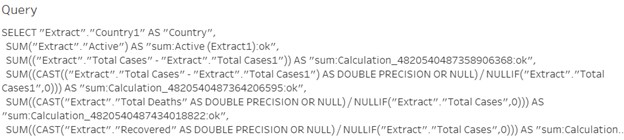
You can see if it possible to optimize this query so that the performance will get improved.
Detailed Tab:
Detailed tab gives you the detailed information about all the events
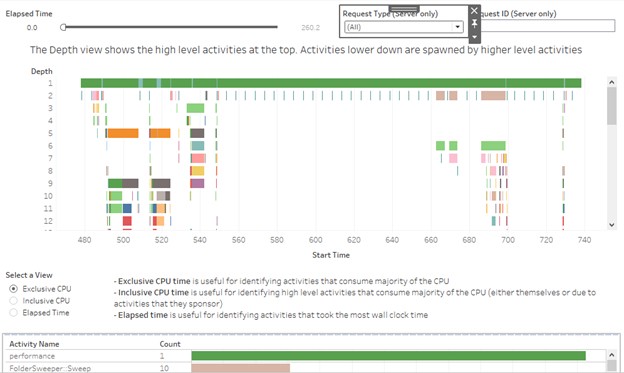
Depth gives us the information about the activities that are performed under each of the events like changing a filter or loading a visualization like Exclusive Time, Inclusive time and Elapsed Time.
Exclusive CPU time helps in understanding those activities which took major of the time.
Inclusive CPU time is time taken by the activities including CPU.
Elapsed time is the time that has been taken by small activities on normal clock.
Don’t forget to give us your ? !


What is Performance Recording in Tableau? was originally published in Becoming Human: Artificial Intelligence Magazine on Medium, where people are continuing the conversation by highlighting and responding to this story.
