
In this blog, I’m going to create a few ML models using Scikit-learn library and we’ll compare the accuracy for each of them.
For complete source code and dataset, you can visit my repository. (Link mentioned at the end of this blog).

About Dataset
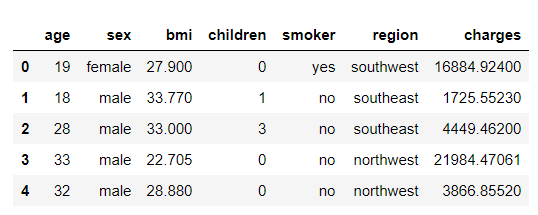
This dataset contains 7 features as shown below:
age: age of the policyholder
sex: gender of policyholder (female=0, male=1)
BMI: Body mass index, providing an understanding of the body, weights that are relatively high or low relative to height, objective index of body weight (kg / m ^ 2) using the ratio of height to weight, ideally 18.5 to 25
steps: average walking steps per day of the policyholder
children: number of children/dependents of the policyholder
smoker: smoking state of policyholder (non-smoke=0;smoker=1)
region: the residential area of the policyholder in the US (northeast=0, northwest=1, southeast=2, southwest=3)
charges: individual medical costs billed by health insurance.

This dataset is available in Kaggle. Click here to navigate to Kaggle website.
So let’s jump on coding.
Import necessary libraries
import numpy as np
import pandas as pd
import matplotlib.pyplot as plt
import seaborn as sns
Load Dataset
dataset = pd.read_csv(‘insurance.csv’)
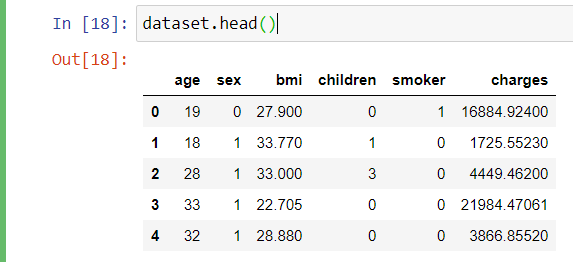
Viewing the first 5 of the dataset
dataset.head()
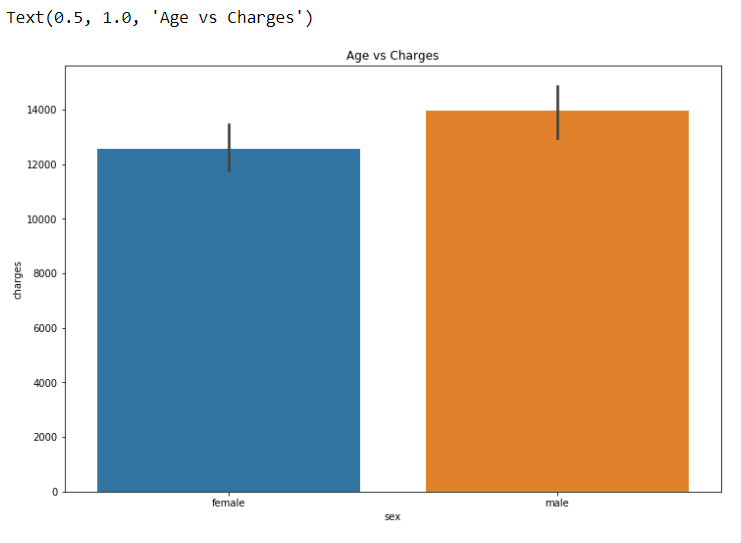
Plotting Bar Graph using all the features VS “Charges”
plt.figure(figsize = (12, 8))
sns.barplot(x = ‘sex’, y = ‘charges’, data = dataset)
plt.title(“Age vs Charges”)
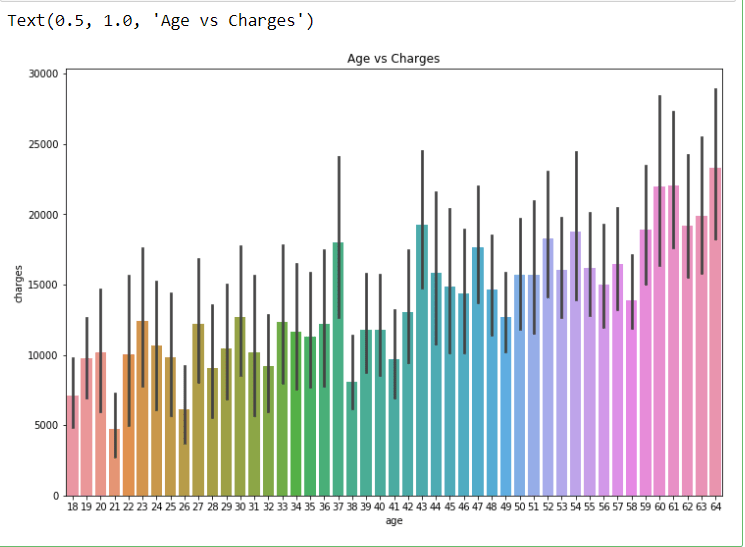
plt.figure(figsize = (12, 8))
sns.barplot(x = ‘age’, y = ‘charges’, data = dataset)
plt.title(“Age vs Charges”)
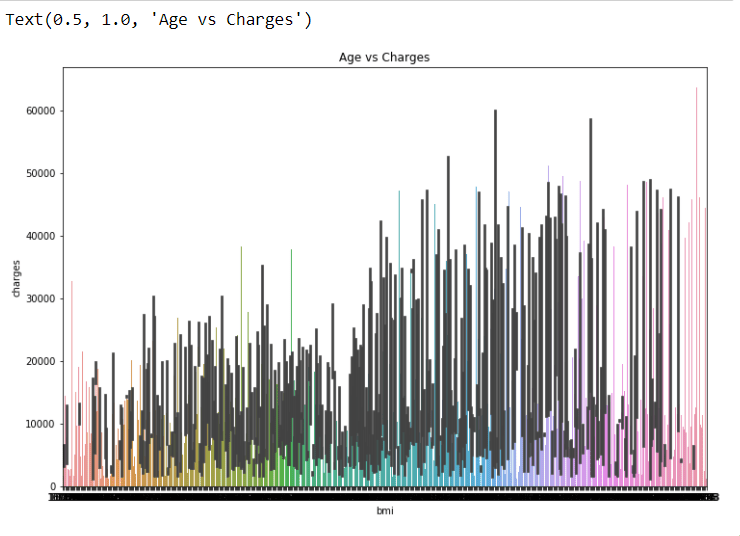
plt.figure(figsize = (12, 8))
sns.barplot(x = ‘bmi’, y = ‘charges’, data = dataset)
plt.title(“Age vs Charges”)
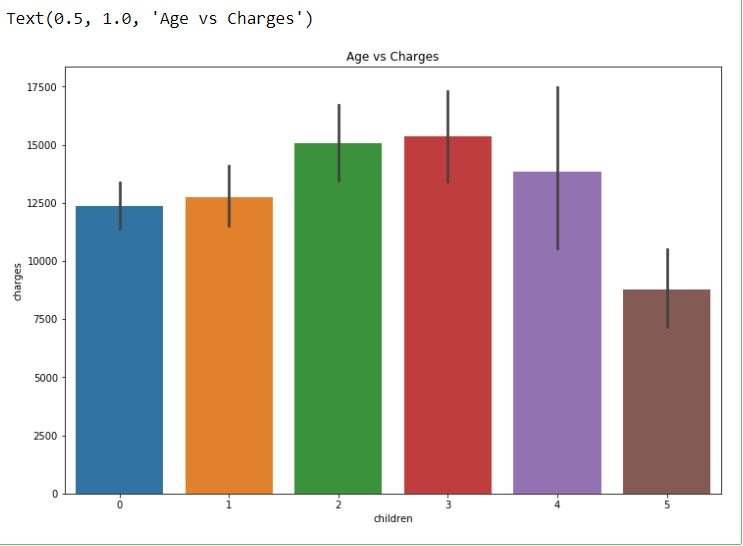
plt.figure(figsize = (12, 8))
sns.barplot(x = ‘children’, y = ‘charges’, data = dataset)
plt.title(“Age vs Charges”)
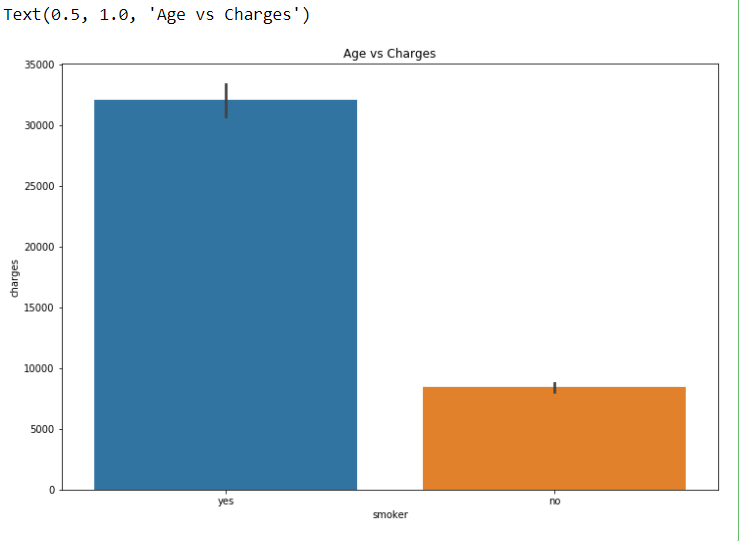
plt.figure(figsize = (12, 8))
sns.barplot(x = ‘smoker’, y = ‘charges’, data = dataset)
plt.title(“Age vs Charges”)
plt.figure(figsize = (12, 8))
sns.barplot(x = ‘region’, y = ‘charges’, data = dataset)
plt.title(“Age vs Charges”)
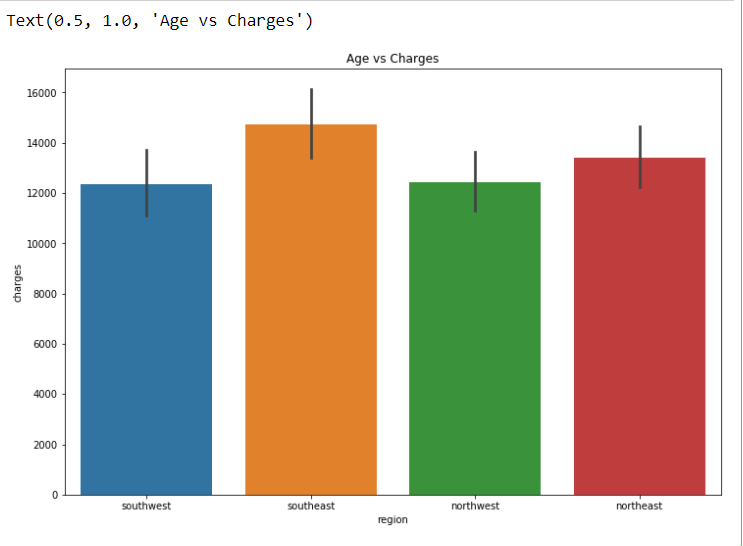
Here I feel we can drop one feature ie. “region” because it is not much important for prediction.
#Dropping least important feature of the dataset
dataset = dataset.drop(‘region’, axis = 1)
Label encoding for “sex” and “smoker”
from sklearn.preprocessing import LabelEncoder
le = LabelEncoder()
dataset[‘sex’] = le.fit_transform(dataset[‘sex’])
dataset[‘smoker’] = le.fit_transform(dataset[‘smoker’])
Assigning X and y
X = dataset.iloc[:,:5]
y = dataset.iloc[:,5]
print(X.shape)
print(y.shape)
Splitting Dataset into testing and training
from sklearn.model_selection import train_test_split
X_train, X_test, y_train, y_test = train_test_split(X, y, test_size = 0.2, random_state = 30)
Applying StandardScalar to X_train and y_test
from sklearn.preprocessing import StandardScaler
# creating a standard scaler
sc = StandardScaler()
# feeding independents sets into the standard scaler
X_train = sc.fit_transform(X_train)
X_test = sc.fit_transform(X_test)
Applying Linear Regressor Model
# Linear Regression
from sklearn.linear_model import LinearRegression
# creating the Linear Regression model
lR = LinearRegression()
# # feeding the training data to the model
lR.fit(X_train, y_train)
y_pred_lR = lR.predict(X_test)
lR.score(X_train,y_train)
>>0.7463716002316689
Applying Support Vector Machine Model
from sklearn.svm import SVR
# creating the model
svr = SVR()
# feeding the training data to the model
svr.fit(X_train, y_train)
# predicting the test set results
y_pred_svr = svr.predict(X_test)
svr.score(X_train,y_train)
>>-0.09361994960428022
Applying Random Forest Model
from sklearn.ensemble import RandomForestRegressor
regressor = RandomForestRegressor(n_estimators = 10, random_state = 0)
regressor.fit(X_train, y_train)
# Predicting a new result
y_pred = regressor.predict(X_test)
regressor.score(X_train,y_train)
>>0.9641035089873307
So we can notice that the Random Forest Model is predicting the best accuracy for our problem.
To access complete code click here. I request you all to work with this dataset can try to get better accuracy. You can connect with me on my social media mentioned below.
I hope you like this blog. Feel free to share your thoughts in the comment section and you can also connect with me in Linkedin.
Thank You.
Don’t forget to give us your ? !


Machine Learning Model For Predicting Insurance Claim Charge. was originally published in Becoming Human: Artificial Intelligence Magazine on Medium, where people are continuing the conversation by highlighting and responding to this story.
