
1. Introduction
Road traffic accidents are a leading cause of death in young people in the Unites States [1][2]. The average number of car accidents in the U.S. is 6 million car accidents every year, and about 6% of those accidents result in at least one death. 3 million people are injured as a result of car accidents and around 2 million drivers experience permanent injuries every year [3].
Analyzing historical vehicle crash data can help us understand the most common factors, including environmental conditions (weather, road surface conditions, and lighting conditions) and their correlation with accident severity. This information can be used to create a prediction model that can be used in conjunction with other Apps like Google Maps to predict the severity of an accident to help drivers be more alert to what can commonly lead to a severe accident. For this project, data from the City of Seattle’s’ Police Department for the years 2004 until present are utilized.
2. Data
In this project, shared data for Seattle city from Applied Data Science Capstone Project Week1 are used [4]. The dataset consists of 38 columns, 35 columns are the attributes or independent variables. One column* (column A and N) is the dependent or the predicted variable, SEVERITYCODE, and another column (column O) is the description of the code, SEVERITYDESC. The predicted variable has two values: either 1 for property damage only collision or 2 for injury collision. The dataset has more than 194,000 records representing all types of collisions provided by Seattle Police Department and recorded by Traffic record in the timeframe 2004 to 2020. This study aims to predict the impact of environmental conditions of the accidents, namely: WEATHER, ROADCAND, and LIGHTCOND. Brief explanation of each attribute can be found in the file uploaded to Github in the link below.
https://github.com/Yusser89/Coursera_Capstone/blob/master/IBMCapstoneProjectWee1_Part2.pdf
- There is a duplicate, column A and Column N both represent SEVERITYCODE
2.1. Feature Selection
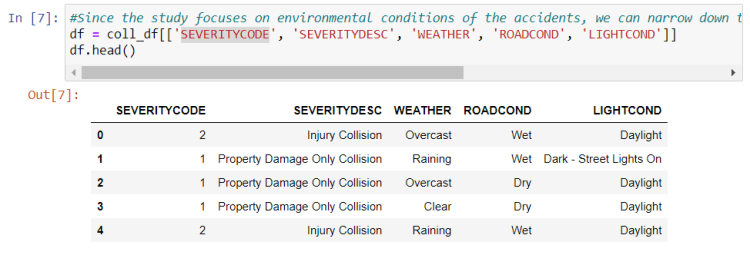
Since the study focuses on environmental conditions of the accidents, we can narrow down the dataset to ‘WEATHER’, ‘ROADCOND’, and ‘LIGHTCOND’.
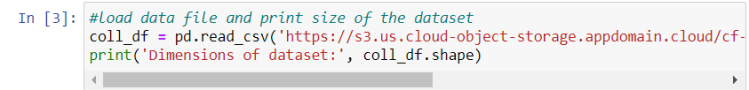
We begin by importing main libraries followed by loading data file and printing the size of the dataset.


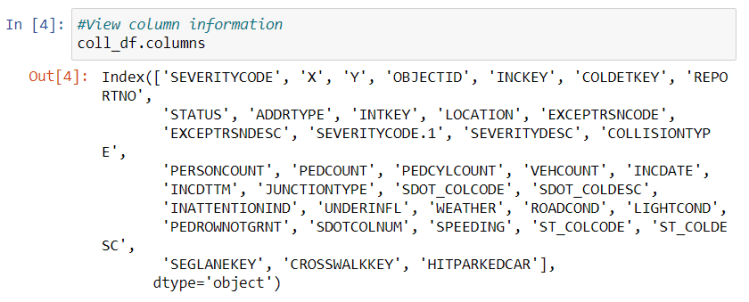
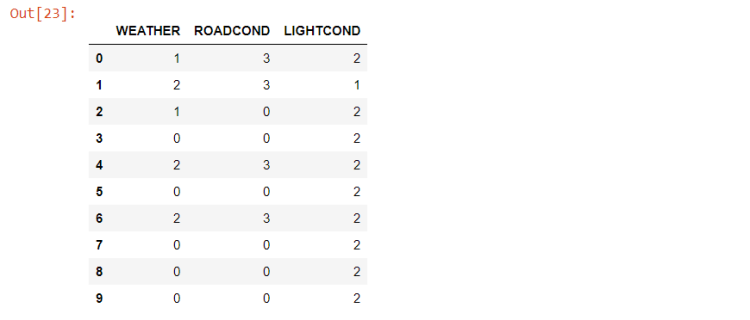
We can view the columns and first five rows of the dataset to get an idea of the data we are dealing with.

The target variable, ‘SEVERITYCODE’, is described by ‘SEVERITYDESC’. Let’s see how many different codes we have.
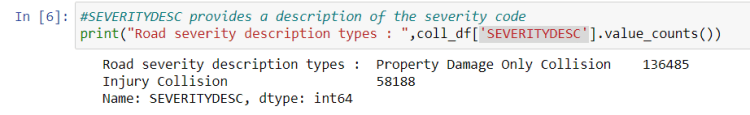
So we have two severity codes: 1 for property damage only collision and 2 for injury collision.
We then narrow down our dataset to the features of interest, namely: ‘WEATHER’, ‘ROADCOND’, ‘LIGHTCOND’.

2.2. Handling Missing Data
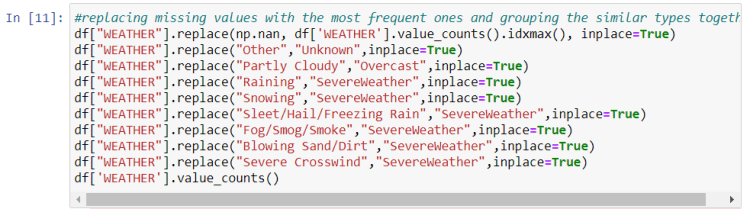
The dataset consists of raw data so there is missing information. First we will search for question marks and replace them with NANs. Then we will replace all NAN values with the most frequent data from each attribute. In addition to that, we are going to group some types of the features together if they are related to each other.

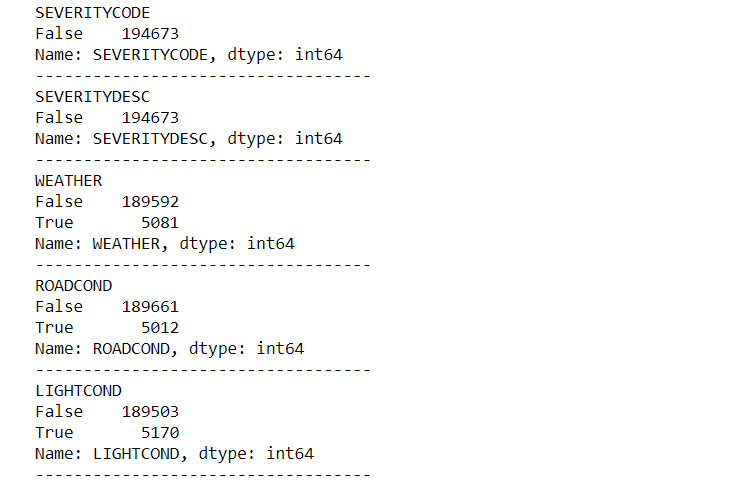
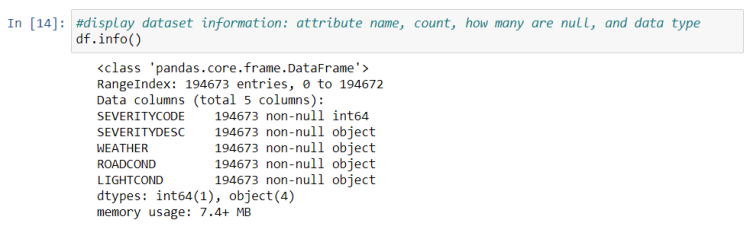
From the results above, it can be seen that we are missing 5081 weather data, 5012 road condition data, and 5170 light condition data. This missing information needs to be addressed.
Trending AI Articles:
1. Fundamentals of AI, ML and Deep Learning for Product Managers
3. Graph Neural Network for 3D Object Detection in a Point Cloud
4. Know the biggest Notable difference between AI vs. Machine Learning
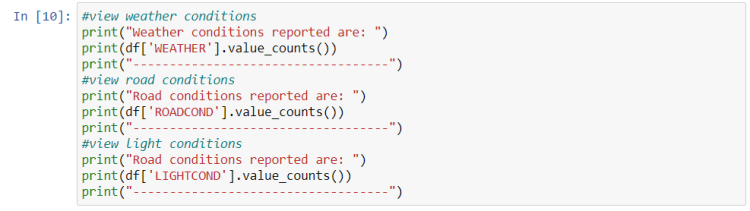
Let’s also explore the different types of each feature to see if we can group them together

Weather conditions can be grouped as follows:
SevereWeather: Raining, Snowing, Sleet/Hail/Freezing Rain, Fog/Smog/Smoke, Blowing Sand/Dirt, Severe Crosswind
Overcast: PartlyCloudy and Overcast
Unknown: Other

Road conditions can be grouped as follows:
IceOilWaterSnow: Ice, Standing Water, Oil, Snow/Slush, Sand/Mud/Dirt
Unknown: Other

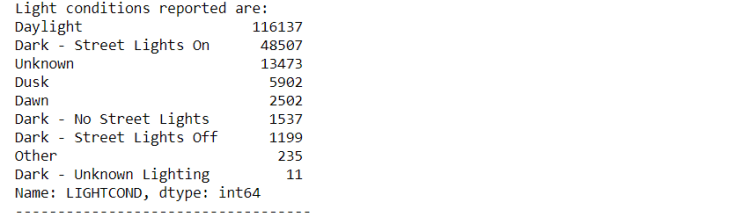
Light conditions can be grouped as follows:
Dark-No-Light: Dark — No Street Lights, Dark — Street Lights Off, Dark — Unknown Lighting
Dark-With-Light: Dark — Street Lights On
DuskDawn: Dusk, Dawn
Unknown: Other

Let’s check if we have any null values
3. Methodology
In this section of the report, exploratory data analysis, inferential statistical testing, and machine learnings used are described.
3.1. Data Visualization
Number of accidents are plotted against each environmental factor (feature) with percentage of each type of each feature to understand the impact of each factor.
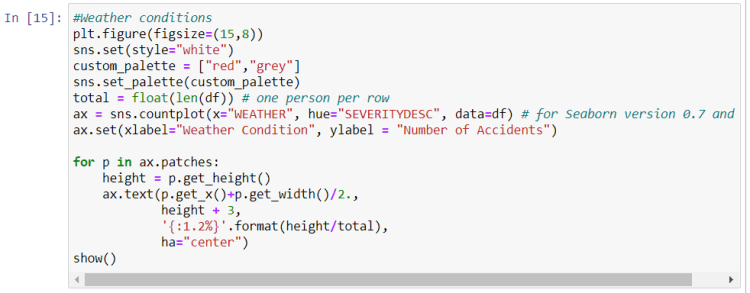
First let’s see the impact of weather conditions.
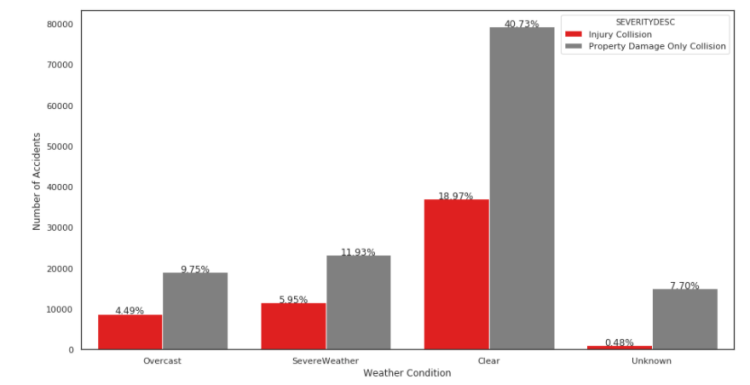
We can see from the graph above that majority of the accidents happened in clear weather. I was expecting to see more accidents in severe weather.
We need more information on ‘Unknown’ weather conditions as the percentage should not be neglected particularly for accidents that caused property damage only.
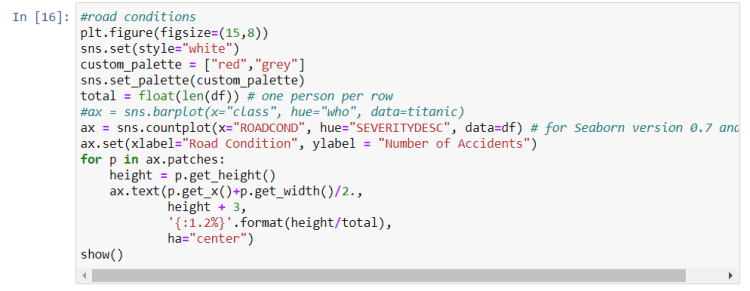
Let’s now see the impact of road conditions.
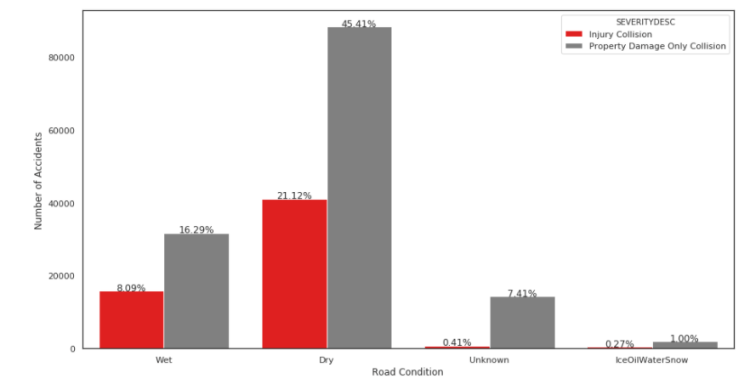
We can see from the graph above that majority of the accidents happened on dry roads. I was expecting to see more accidents on wet or icy, snowy, oily roads! We also need more information on ‘Unknown’ road conditions as the percentage should not be neglected particularly for accidents that caused property damage only.
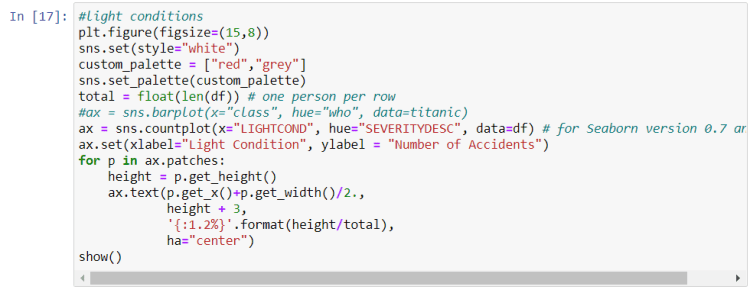
And finally let’s examine the impact of light conditions.
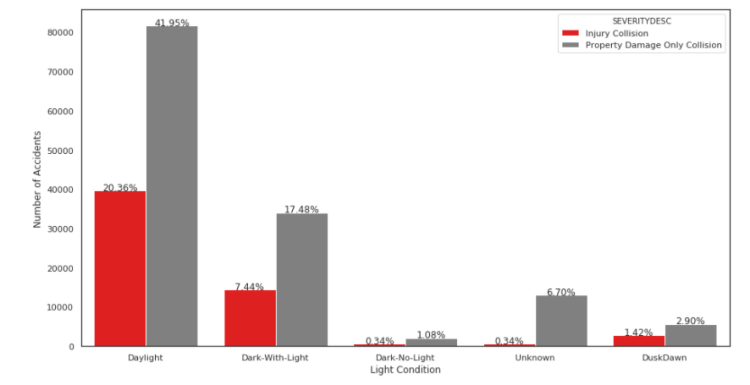
It can be seen from the graph above that majority of accidents happened during the day with daylight. This also was not as I expected! Again, we need more information on ‘Unknown’ light conditions as the percentage should not be neglected particularly for accidents that caused property damage only.
3.2 Machine Learning Model Selection
The preprocessed dataset can be split into training and test sub datasets (70% for training and 30% for testing) using the scikit learn “train_test_split” method. Since the target column (SEVERITYCODE) is categorical, a classification model is used to predict the severity of an accident. Three classification models were trained and evaluated, namely: K-Nearest Neighbor, Decision Tree, and Logistic Regression.
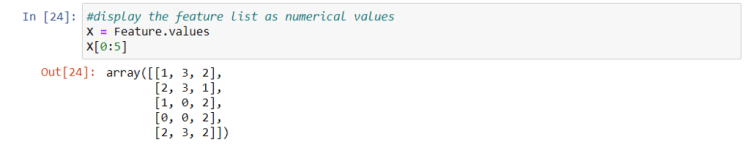
We will start by defining the X (independent variables) and y (dependent variable) as follows.

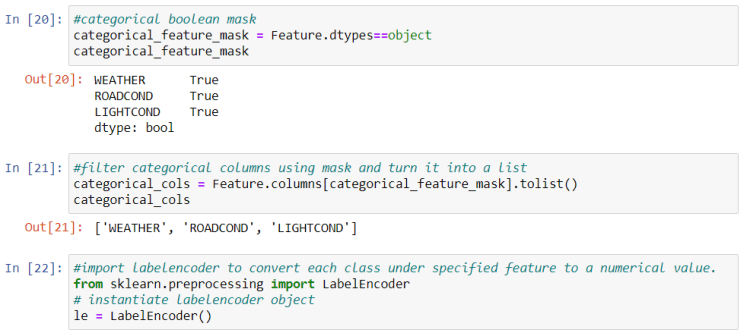
X data needs to be converted to numerical data to be used in the classification models. This can be achieved by using Label Encoding.

It is always better to normalize the features data.


3.2.1. Model
It’s time to build our models by first splitting our data into training and testing sets of 70% and 30% respectively.

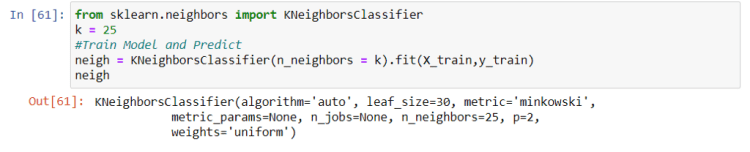
3.2.1.1. K Nearest Neighbor(KNN)
KNN is used to predict the severity of an accident of an unknown dataset based on its proximity in the multi-dimensional hyperspace of the feature set to its “k” nearest neighbors, which have known outcomes. Since finding the best k is memory-consuming and time-consuming, we will use k=25 based on [5].


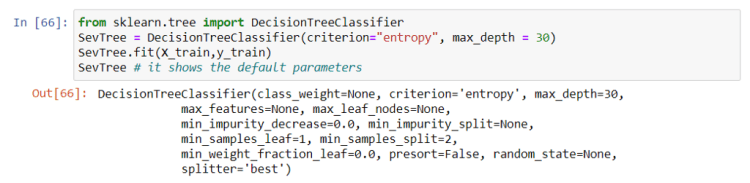
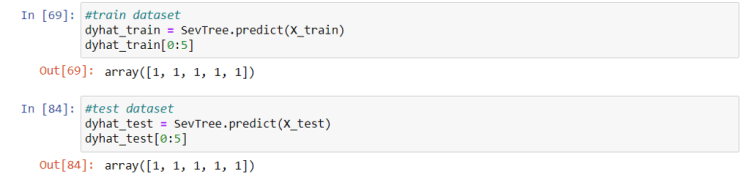
3.2.1.2. Decision Tree
A decision tree model is built from historical data of accident severity in relationship to environmental conditions. Then the trained decision tree can be used to predict the severity of an accident. Since finding the maximum depth is also memory and time consuming, will use max_depth=30 based on [5].
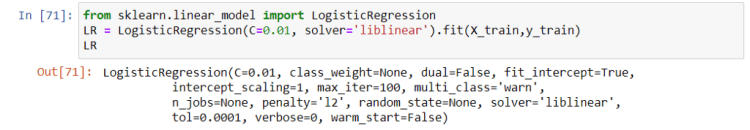
3.2.1.3. Logistic Regression
Logistic Regression is useful when the observed dependent variable, y, is categorical. It produces a formula that predicts the probability of the class label as a function of the independent variables. An inverse-regularisation strength of C=0.01 is used as in [5].

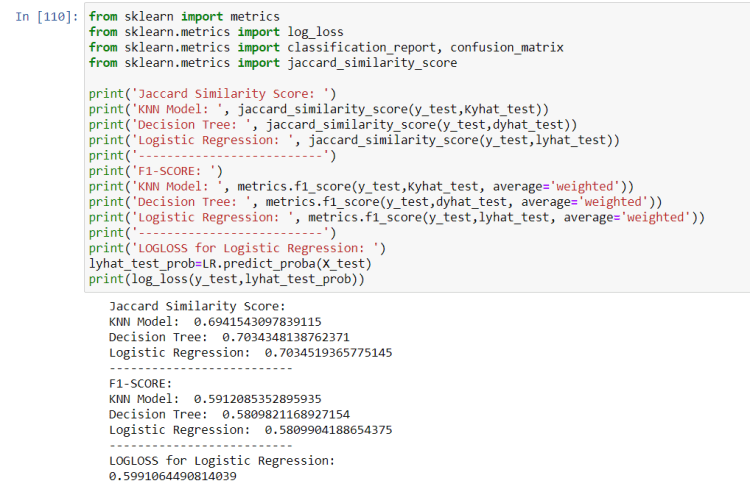
4. Results (Model Evaluation)
Accuracy of the 3 models is calculated using these metrics: Jaccard Similarity Score, F1-SCORE, and LOGLOSS (with Linear Regression).
5. Discussion
First the dataset had categorical data of type ‘object’. Label encoding was used to convert categorical features to numerical values. The imbalanced data issue was ignored because there was a problem installing imbalanced-learn to use imblearn.
Once data was cleaned and analyzed, it was fed into three ML models: K-Nearest Neighbor, Decision Tree, and Logistic Regression. Values of k, max depth and inverse-regularisation strength C were taken from [5]. Evaluation metrics used to test the accuracy of the models were Jaccard Similarity Index, F-1 SCORE and LOGLOSS for Logistic Regression.
It is highly recommended to solve the data imbalance problem for more accurate results.
6. Conclusion
The goal of this project is to analyze historical vehicle crash data to understand the correlation of environmental conditions (weather, road surface, and lighting conditions) with accident severity. Vehicle accident data from the City of Seattle’s’ Police Department for the years 2004 until present were Used. The data was cleaned, and features related to environmental conditions were selected and analyzed. It was found that majority of accidents happened in clear weather, dry roads, and during daytime which wasn’t what I expected. Machine learning models; K-Nearest Neighbor, Decision Tree and Logistic Regression were used to predict the severity of an accident based on certain environmental conditions. The models used were also evaluated using different accuracy metrics.
7. References
- Road Traffic Injuries and Deaths — A Global Problem. CDC, Center for Disease Control and Prevention, https://www.cdc.gov/injury/features/global-road-safety/index.html#:~:text=Road%20traffic%20crashes%20are%20a,citizens%20residing%20or%20traveling%20abroad.
- Road Traffic Injuries. WHO, Global Health Observation Data, https://www.who.int/health-topics/road-safety#tab=tab_1
- Car Accident Statistics in the U.S. Driver Knowledge, https://www.driverknowledge.com/car-accident-statistics/#:~:text=U.S.%20every%20year%20is%206,experience%20permanent%20injuries%20every%20year
- Shared data for Seattle city from Applied Data Science Capstone Project Week1, https://s3.us.cloud-object-storage.appdomain.cloud/cf-courses-data/CognitiveClass/DP0701EN/version-2/Data-Collisions.csv
- Seattle Car Accident Severity — IBM Capstone Project by AP Thomson, https://medium.com/@alasdair.p.thomson/seattle-car-accident-severity-ibm-capstone-project-9cef20fc7e6adn
Thank you for reading!
Yusser Al-Qazwini
Don’t forget to give us your ? !


IBM Data Science Capstone: Car Accident Severity Report was originally published in Becoming Human: Artificial Intelligence Magazine on Medium, where people are continuing the conversation by highlighting and responding to this story.
