

When we get the data, after data cleaning, pre-processing and wrangling, the first step we do is to feed it to an outstanding model and of course, get output in probabilities. But hold on! How in the hell can we measure the effectiveness of our model. Better the effectiveness, better the performance and that’s exactly what we want. And it is where the Confusion matrix comes into the limelight. Confusion Matrix is a performance measurement for machine learning classification.
This blog aims to answer following questions:
- What the confusion matrix is and why you need it?
- How to calculate Confusion Matrix for a 2-class classification problem?
Today, let’s understand the confusion matrix once and for all.
What is Confusion Matrix and why you need it?
Well, it is a performance measurement for machine learning classification problem where output can be two or more classes. It is a table with 4 different combinations of predicted and actual values.

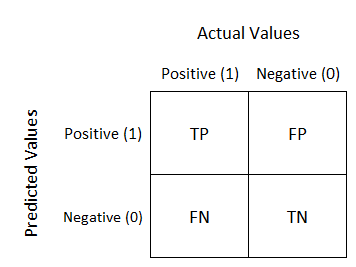
It is extremely useful for measuring Recall, Precision, Specificity, Accuracy and most importantly AUC-ROC Curve.
Let’s understand TP, FP, FN, TN in terms of pregnancy analogy.
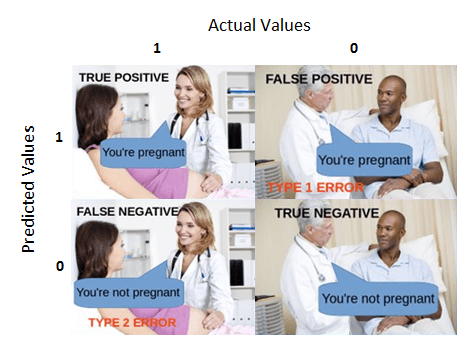
True Positive:
Interpretation: You predicted positive and it’s true.
You predicted that a woman is pregnant and she actually is.
True Negative:
Interpretation: You predicted negative and it’s true.
You predicted that a man is not pregnant and he actually is not.
False Positive: (Type 1 Error)
Interpretation: You predicted positive and it’s false.
You predicted that a man is pregnant but he actually is not.
Trending AI Articles:
1. How to automatically deskew (straighten) a text image using OpenCV
3. 5 Best Artificial Intelligence Online Courses for Beginners in 2020
4. A Non Mathematical guide to the mathematics behind Machine Learning
False Negative: (Type 2 Error)
Interpretation: You predicted negative and it’s false.
You predicted that a woman is not pregnant but she actually is.
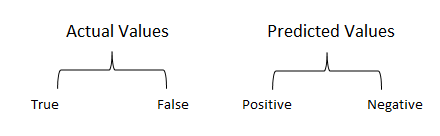
Just Remember, We describe predicted values as Positive and Negative and actual values as True and False.
How to Calculate Confusion Matrix for a 2-class classification problem?
Let’s understand confusion matrix through math.
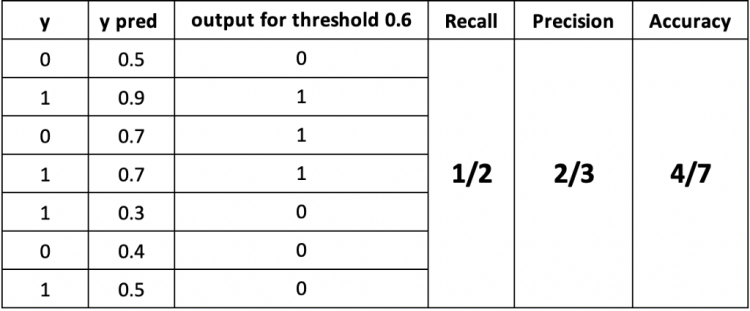
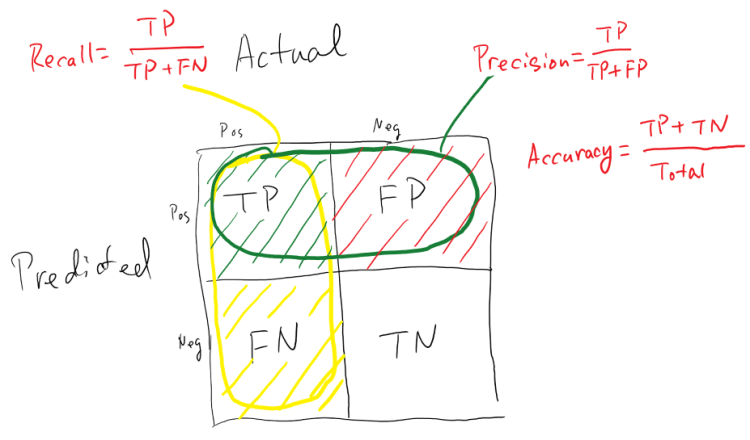
Recall
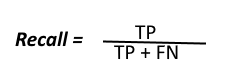
Out of all the positive classes, how much we predicted correctly. It should be high as possible.
Precision
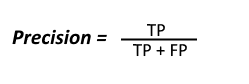
Out of all the positive classes we have predicted correctly, how many are actually positive.
Accuracy

Out of all the classes, how much we predicted correctly, which will be, in this case 4/7. It should be high as possible.
F-measure
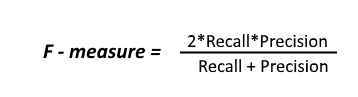
It is difficult to compare two models with low precision and high recall or vice versa. So to make them comparable, we use F-Score. F-score helps to measure Recall and Precision at the same time. It uses Harmonic Mean in place of Arithmetic Mean by punishing the extreme values more.
I hope I’ve given you some basic understanding on what exactly is confusing matrix. If you like this post, a tad of extra motivation will be helpful by giving this post some claps ?. I am always open for your questions and suggestions. You can share this on Facebook, Twitter, Linkedin, so someone in need might stumble upon this.
You can reach me at:
LinkedIn : https://www.linkedin.com/in/narkhedesarang/
Github : https://github.com/meetvansjaliya
Thanks for Reading!
Don’t forget to give us your ? !


Understanding Confusion Matrix was originally published in Becoming Human: Artificial Intelligence Magazine on Medium, where people are continuing the conversation by highlighting and responding to this story.
Via https://becominghuman.ai/understanding-confusion-matrix-eb6f0f662c3a?source=rss—-5e5bef33608a—4
source https://365datascience.weebly.com/the-best-data-science-blog-2020/understanding-confusion-matrix
