

Background and Motivation
There’s so much hype about data and data related jobs. With the amount of learning material available online and the variety and depth of topics in data science and data engineering, it’s easy for a newcomer to get confused about what exactly to learn and how to go about getting a job in a data related field. Because learning data related skills like machine learning and getting a job in a related field are very different things, I decided to take a look at Kaggle’s 2020 data science survey. Kaggle is an online platform that hosts data science competitions, discussions , datasets and kernels. The platform has over a million users from all over the world. The survey was live for 3.5 weeks and had questions about almost everything related to data science from demographics of the practitioners to daily activities of data professionals.
Questions I try to answer in this analysis
I’m sure that most people trying to break into data related fields have these questions . So without further ado, I’ll list the questions I’m going to explore here
- Who are the participants of the survey
- What kind of salary should one expect
- What are age groups of professionals
- Gender distribution
- Best countries to work in
- What kind of educational qualifications does one need to succeed
- Data professionals across different sized companies -head count, salary
- Extent of ML adoption in companies of different sizes
- Development Environments — what IDEs are used
- Most Popular hosted notebooks
- Coding Experience across different roles
- Popular Coding Languages
- Popular visualization libraries
- How much ML experience is required
- Popular machine learning Frameworks
- Choice of learning platforms

Section 1: Who were the respondents in the survey?
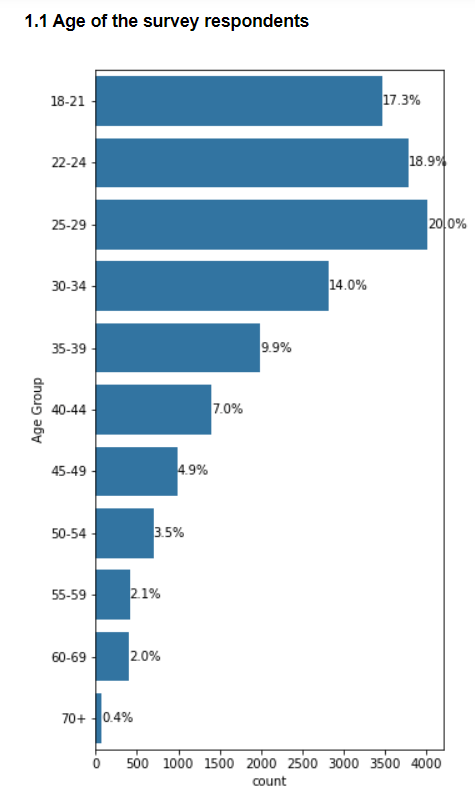
1.1 Age
Here 69% of the respondents are below 35 years of age and 55% are below 30 years of age. This is inline with the fact that most data professions came into the spotlight very recently
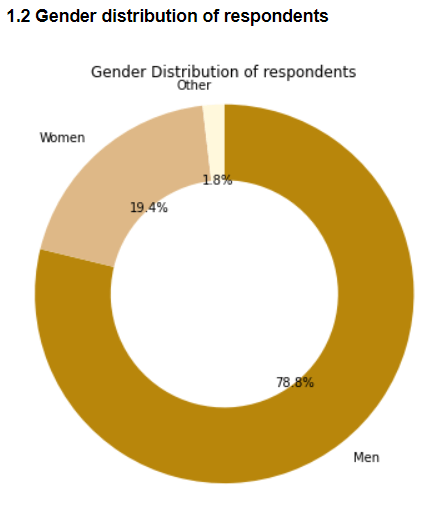
1.2 Gender Distribution
Roughly 78% of the respondents were men, 19.4% were women and 1.8% were other genders, This is a trend commonly seen in other technical fields as well
1.3 Country of Residence
Most of the participants were from India and U.S. followed by Brazil, Japan and U.K.

Section 2: A closer look at data professionals
For the purpose of this analysis, I’ll consider anyone who has described their work in some form in the survey. There were a few people who seem to be employed, but did not describe their role. So I have omitted these people. The question to describe one’s job had the following options
- Analyze and understand data to influence product or business decisions
- Build and/or run the data infrastructure that my business uses for storing, analyzing, and
operationalizing data - Build prototypes to explore applying machine learning to new areas
- Build and/or run a machine learning service that operationally improves my product or
workflows - Experimentation and iteration to improve existing ML models
- Do research that advances the state of the art of machine learning
- None of these activities are an important part of my role at work
- Other
After applying the above criteria, there were roughly 9142 data professionals among 20,000 respondents
Trending AI Articles:
2. Generating neural speech synthesis voice acting using xVASynth
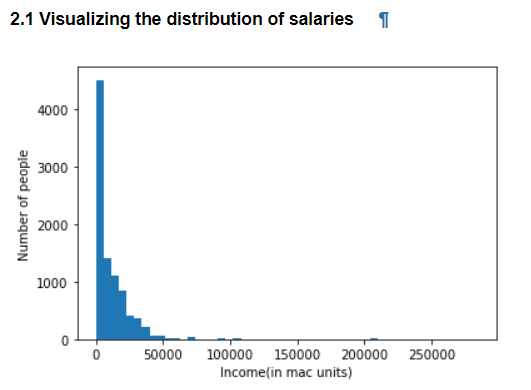
2.1 Salary Distribution
For comparing salaries across different countries, I have converted salaries in USDto purchasing power parity using the Big Mac index since the value of a given amount of money, say $100 varies in different regions across the world. Henceforth, salary will be in number of mac units. Salary distribution for the entire sample is shown below. As expected, it is a right skewed distribution with a long tail. Majority of the people earn less than 50,000 units while there are extremely high earning individuals, earning as high as >300,000 units
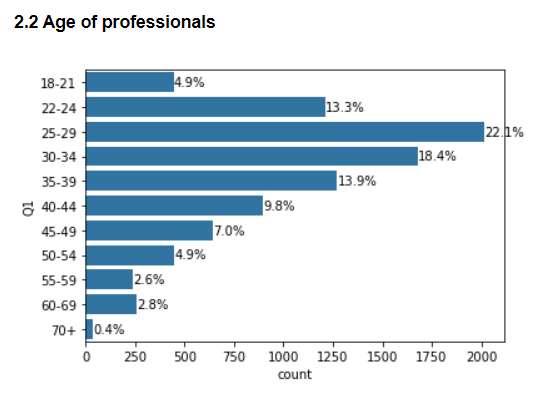
2.2 Age of professionals
Most professionals fall in the 25–29 years age group with 30–34 years and 22–24 years being the next highest groups. Overall more than half of the professionals are aged between 22 and 34 years
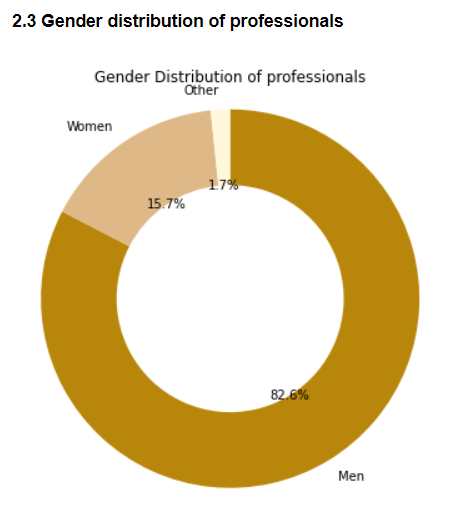
2.3 Gender Distribution of professionals
Similar to the trend observed with the survey respondents, roughly 83% of the professionals are men,16% women and remaining 1% are other genders
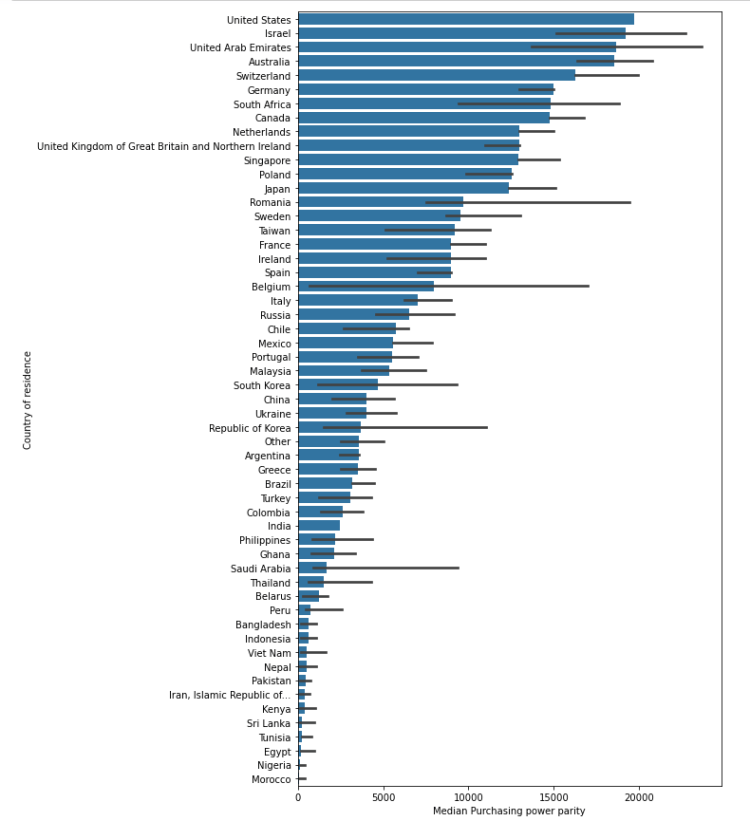
2.4 Pay variation with country
Here I plot the median salaries of each country to find out the where the median salaries for data professionals is the highest. Turns out US, Israel, UAE, Australia and Switzerland are top 5 countries with highest median salaries in the world. PPP here is calculated based on the big mac index which is a widely used number for assessing PPP. All aspects of cost of living may not be represented well by the index, but it gives a good rough estimate of the highest paying places in the world
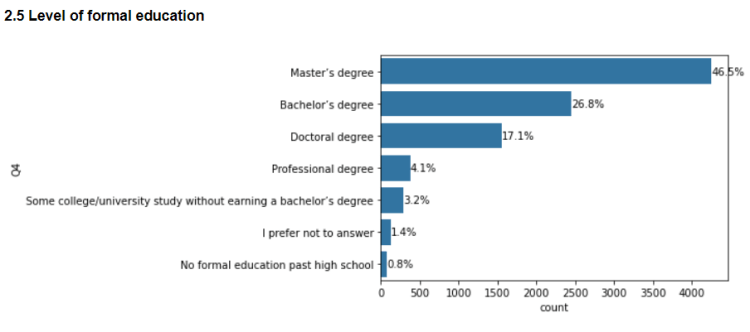
2.5 Level of formal education
Often newcomers in data related fields wonder how much formal education does one need to break into the field. From the data here, it can be seen that around 46% professionals have master’s degrees, 27% having bachelor’s degrees and 17% having a doctorate. Thus having higher education certainly seems to have a significant impact on one’s career prospects in a data related field
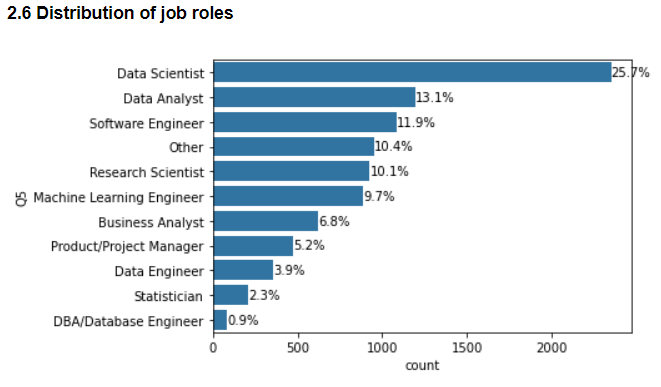
2.6 Distribution of job roles
Data scientists make up the largest proportion of professionals who work with data, followed by data analysts and software engineers.
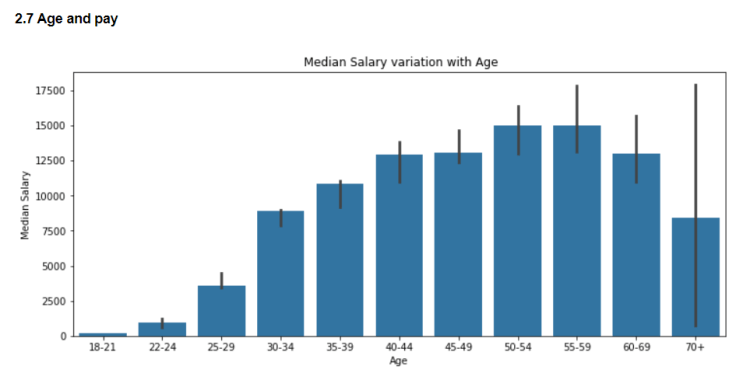
2.7 Age and pay
Here I have plotted the median salaries of different age groups. In general it seems that pay increases with age and experience. It’s also interesting to note that pay variation is higher in higher age groups
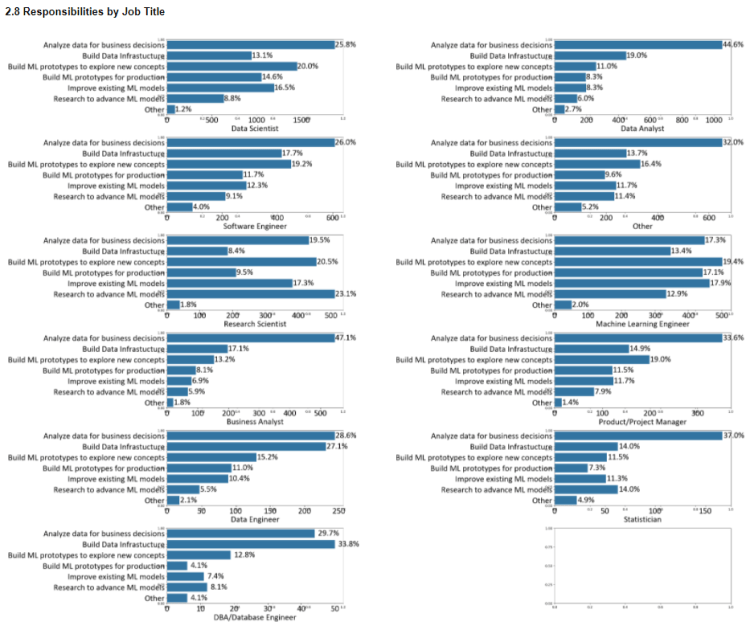
2.8 Responsibilities by job title
- Here I try to explore what professionals do on a day to day basis. Analyzing data for business decisions seems to be the most common responsibility across majority of the job roles. This is not surprising since most time in the data science process is spent in understanding the data and deriving insights from it
- Data Analyst and Business Analyst roles seem very similar in terms of responsibilities
- Data engineers and database engineers have the responsibility of building and maintaining data infrastructure which is less common in other roles
- Data Scientists and Machine learning engineers seem to have the widest variety of responsibilities
2.9 Job title and education
Here I take a look at education of people across different job titles. Masters degree holders form the largest proportion of people across all job titles except for research scientists where majority of the people hold PhDs

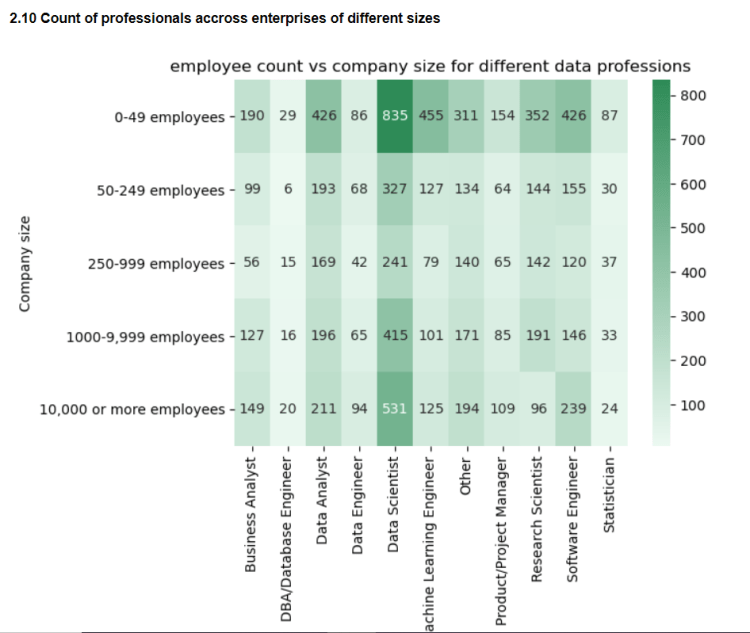
2.10 Count of professionals across companies of different sizes
Here I take a look at the headcount of different job roles across companies of different sizes. It seems like large number of data scientists work in startups and big corporations .Also data scientists form the major proportion of data professionals followed by Data Analysts and software engineers
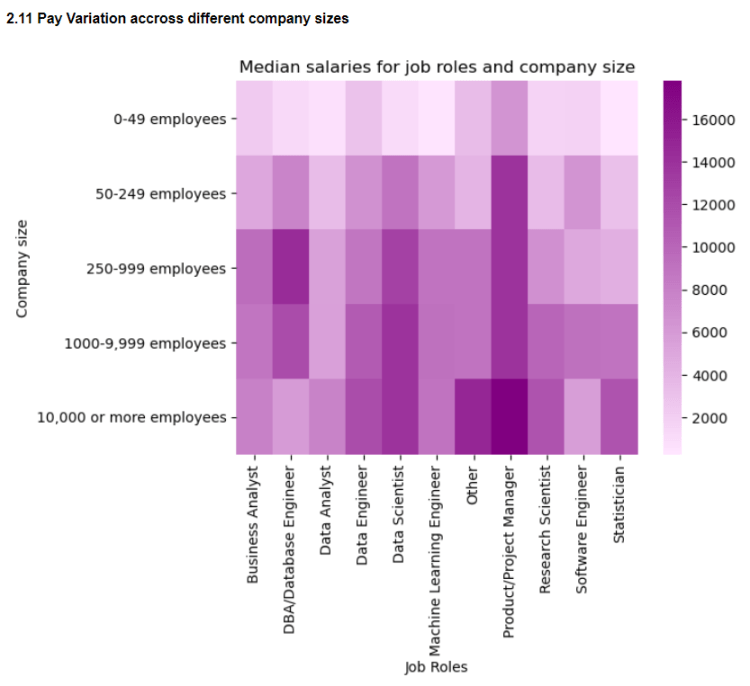
2.11 Pay variation across companies of different sizes
Here I compare median salaries of professionals across organizations of different sizes. In general bigger companies tend to pay more than smaller ones. Also product/project managers seem to be the highest paid positions across organizations of different sizes
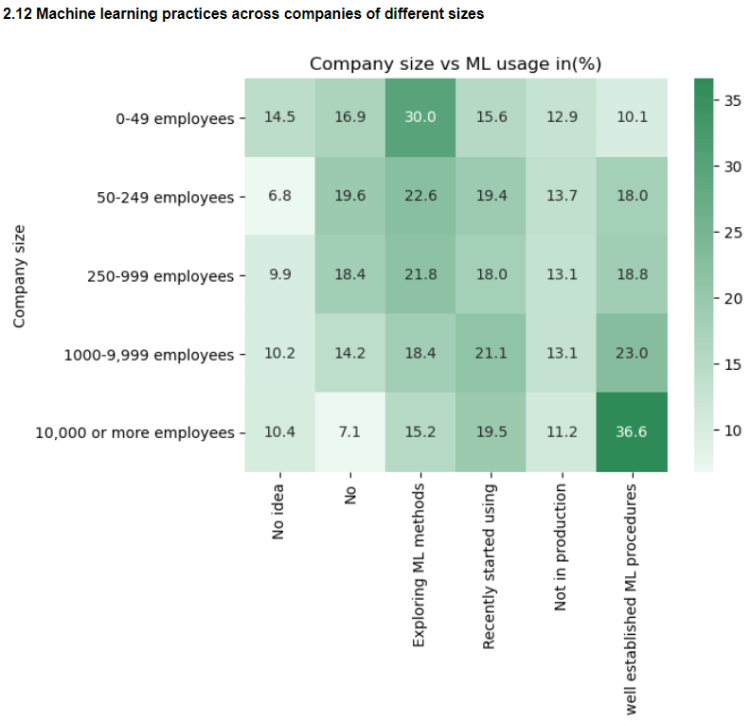
2.12 Extent of ML adoption in companies of different sizes
The extent of machine learning usage is compared across companies of different sizes. It can be seen that big corporations are the ones with well established ML procedures while smaller companies are still at an exploratory stages
2.13 Preferred development environments
Jupyter notebook/ jupyter lab is by far the most preferred tool for building data science workflows followed by Vscode and Pycharm

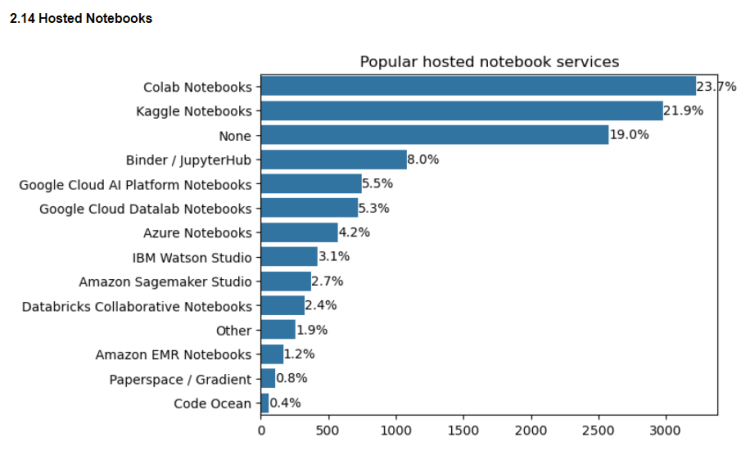
2.14 Popular hosted notebooks
Google colab and Kaggle notebooks seem to be the most popular hosted notebooks. It’s surprising that almost 19% people don’t use any of the hosted notebook services given the amount of compute power available for free
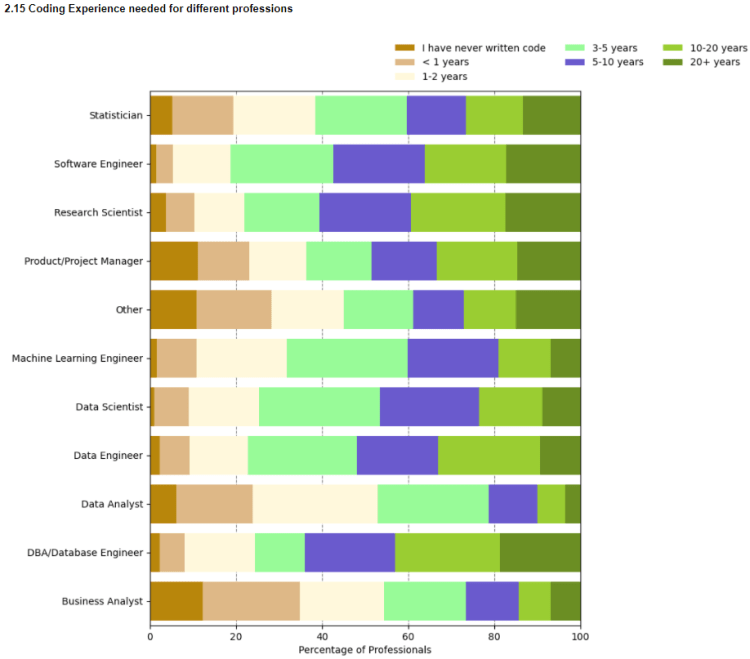
2.15 Coding experience needed for different professions
It’s an interesting question to ask how much coding experience is required to get into these fields. It can be seen that around 30% of professionals across different job titles have less than 2 years of coding experience.
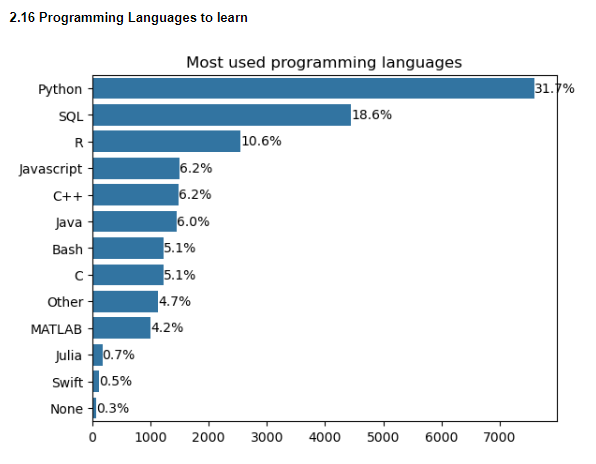
2.16 Programming Languages to learn
Python is by far the most used language in data related jobs while SQL comes in at second. This is not surprising since SQL plays a major role in accessing data from large data warehouses. Thus knowing SQL goes a long way in boosting career prospects of data professionals
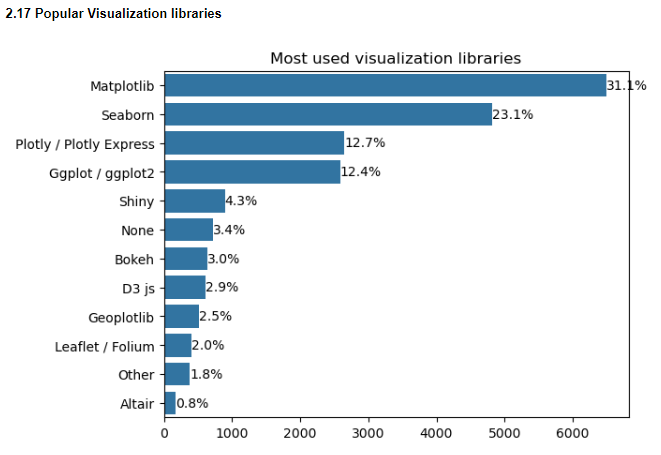
2.17 Popular Visualization libraries
Matplotlib and Seaborn are the most used data visualization libraries since most people start out with these. Plotly produces interactive plots, but requires knowledge of data preprocessing to get certain types of visualizations. ggplot is a visualization library for R
2.18 Years of Machine Learning experience across different professions
About 40% of the people in all professions have machine learning experience of less than 2 years. Professionals like data and business analysts mostly do not have machine learning experience. Also 2 years of coding experience is subjective and can mean different things for different individuals depending on where they studied and number of hours they put in. But 2 years of ML experience is a reasonable goal for people trying to get into the field to strive towards
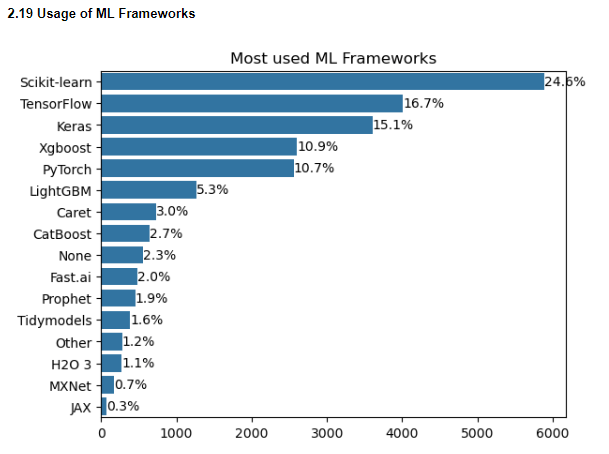
2.19 Usage of ML Frameworks
Scikit learn, Tensorflow and Keras are the most popular ML Frameworks which is mostly what people learn while trying to get into this domain
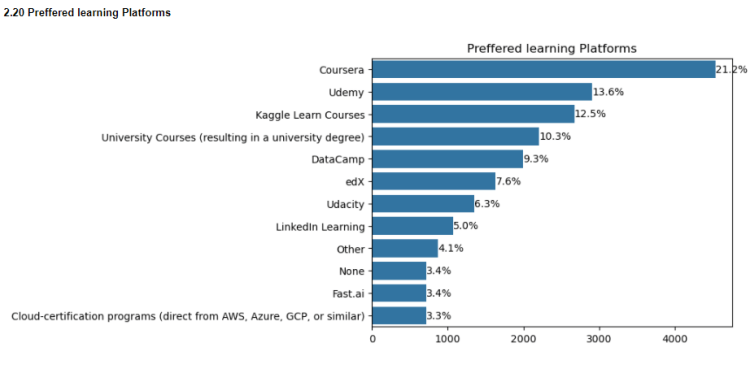
2.20 Preferred learning Platforms
Coursera seems to be the top platform for learning data science followed by Udemy and Kaggle.
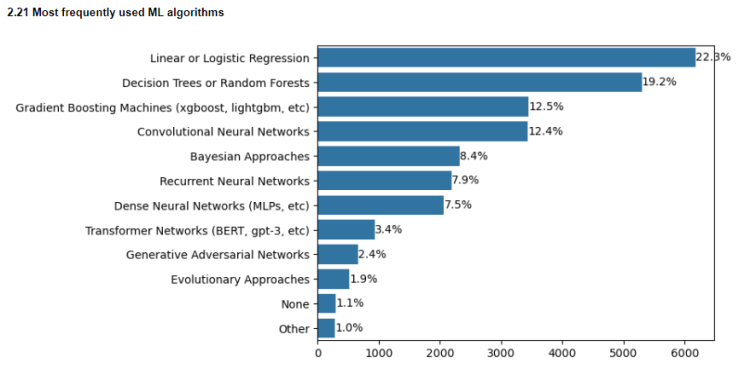
2.21 Most used ML algorithms
Despite the large number of sophisticated ML algorithms, linear/logistic regression and tree based methods remain the top algorithms used for business purposes. This is because the results of these algorithms can be easily explained while more sophisticated deep learning methods may not be interpreted so readily. This also shows the importance of model interpretability for use in business cases
Conclusion
That was a lot of information. But to summarize the major points of this analysis
1. Country of residence plays a big part in determining salaries of data professionals
2. Most professionals across job titles have a bachelor’s or a master’s degree
3. Data scientists form the biggest portion of people working with data
4. Pay increases with experience and company size
5. Python and SQL are go to languages to learn for any data related role
6. A good portion of people working in this feild have less than 2 years of experience with coding and ML and is a reasonable goal for newcomers to strive towards
7. Businesses value deriving insights from data and simple ML algorithms over complex ones
If you are interested in the code for creating the visualizations, check out my Github repository here.
Thank you for reading.
Don’t forget to give us your ? !


Becoming a Data Professional In 2021 was originally published in Becoming Human: Artificial Intelligence Magazine on Medium, where people are continuing the conversation by highlighting and responding to this story.
