
Predictive Maintenance: This Is How Machine Learning /AI can transform Manufacturing Industry — CASE STUDY
Maintenance represents a significant part of all Manufacturing operation’s expenses. Hence Predictive Maintenance has become important part of overall business strategy — which would help client performance monitoring, better reliability, eliminate down-time due to maintenance related failures, and extend operating life of machines. This approach promises cost savings over routine or time based Predictive maintenance.
The data provided in case study consists of temperatures of clean rooms, viz., Main-room and Pre-room. In ideal scenario, pre-room should be heated first and then the main-room. Thus, temperature of main-room should be in sync with temperature of pre-room. Sometimes, in spite of high heat in main-room, the temperature of pre-room is not as high. This implies that the pre-room is getting heated by main-room, which is an error. E.g., temperature of main-room goes high (greater than 100 degrees C) and pre-room has comparatively low temperature (less than 40 degrees C). Machine learning predictive approach will help us find out when this is going to happen and the root cause for it.


Above visualization depicts Good VS Bad condition of the machines. The X-axis shows the pre room temperature of the machine and Y-axis shows the main room temperature.
The red highlighted part shows the conditions where failure has been observed.
Machine Learning algorithms would predict using large data of machine’s state information and provide output in terms of regular A.I dashboard consisting of analytics of Prediction maintenance.
Below is current proposed architecture of System.
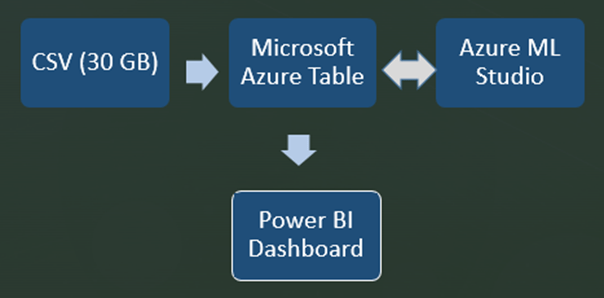
Using large pool of data of around 30 GB, CSV files will be stored in MS Azure Table for Cloud operations. Machine Learning algorithm in Azure ML studio would provide Predictive analysis which will be sent to Azure table. MS Power BI dashboard would provide real time predictive analytics charts.
Azure Cloud Storage
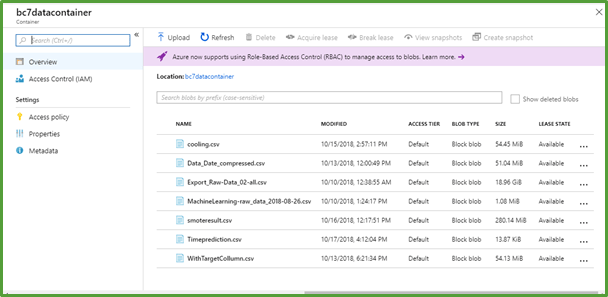
● All information, data will be available on Azure cloud storage tables (Blobs). Data size is almost 20 GB which is into a single large CSV file. This consists of data (temperature, pressure, etc.) generated through the sensors which are fitted on rooms. The data is collected for each second between1st January 2017 and 31st December 2017.
● All the files which got generated during data exploration and analysis as well as Machine learning outputs are stored in the same container for easy access.
Data Exploration Report
● Original Data findings
o Raw data provided to us consists of 30 million records, in single large CSV file. It was provided in Azure Blob storage account- for cloud based analysis.
o CSV file contains data for a whole year 2017, where records got generated for every second starting from Jan 2017 to Dec 2017.
o However, after initial exploration it was found that the records are getting generated after every 5 minutes. There were many duplicates due to multiple sources from which the data was getting generated. The client was informed immediately.
o All the duplicate in data points were removed to retain sanity of data for modelling & predictive dashboards.
o Now original data reduced to ~ 86K records, and records generated every 5 minutes for temperature, pressure, volume of pre-room and main room using corresponding sensors.
o We have also removed few sensors columns which has only single value throughout whole year as they will not be useful for analysis.
Trending AI Articles:
1. Top 5 Open-Source Machine Learning Recommender System Projects With Resources
4. Why You Should Ditch Your In-House Training Data Tools (And Avoid Building Your Own)
● Target Column [Machine Good or Bad conditions]
o Target column has been created with this logic — if the temperature of pre-room is less than 40 degrees AND temperature of main-room is greater than 100 degrees AND difference between temperatures of both is 10 degrees AND if main-room is not in cooling condition — it terms as failure.
o Cooling condition is defined as if main-room has continuous decrease in temperature for 25 minutes.
o Total 446 records where machine shows failure according to the above definition
o There are 43 days where failure was observed.
o Total downtime in the year 2017 was 2230 minutes (37 hours).
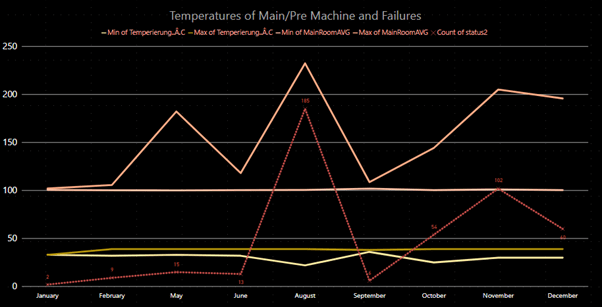
Above interactive figure shows number of failures by Month (Red line). Other lines represent Minimum and Maximum Temperatures of Pre-room and Main-room.
We observed that the highest number of failures observed in August 2017(185 failures) and minimum failures were observed in January 2017(2 failures).
We sensed that there might be seasonality or trends by time. Hence, it is suggested to use time series Machine Learning models which might help us understand failures of the machines. Hence, in later part we will apply Machine learning Model.
Also, as a target variable is binary (pass/fail), a classification algorithm will be used to understand the conditions of failures in machine.
Azure Machine Learning Studio
We will use Azure Machine Learning Studio for building classification based models. We decided to build Logistic Regression and Two class Boosted decision tree approach.
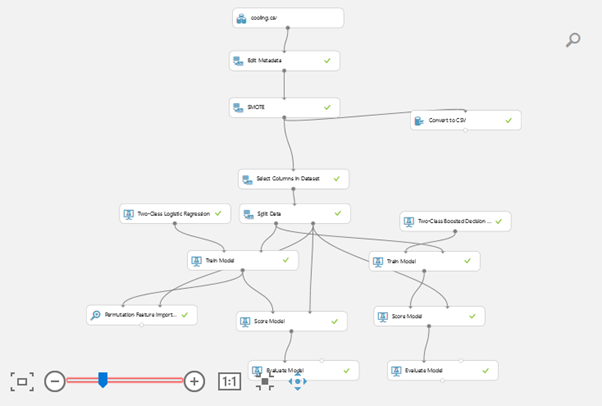
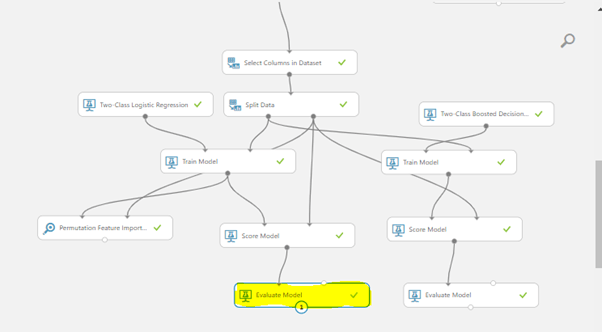
Above screenshot from Azure Machine Learning Studio shows step by step approach for building end to end solution of both Machine Learning Models.
Summary of each step:
● Cooling.csv, Edit Metadata
We import data from Azure VM Machine and select only columns required for building models. As we have used Pre-room and Main-room temperature columns for creating Target column (Status2), those won’t be considered into the set of predictor variables.
● SMOTE (Synthetic Minority Over-Sampling Technique)
In Simple terms, SMOTE function balances the skewed data. Actual Data provided has 99% of records which account to good conditions while only 1% account to bad condition. In such a huge skewed scenario, the machine gets biased towards good condition and hence fails to identify bad condition correctly. Hence, to balance the data, the number of failure records are increased artificially without impacting sanity of dataset using SMOTE function. In this case, the SMOTE helps us to reach to 77% of good and 23% of bad records. It is good ratio for Model to get trained from the data.
● Select Columns in Dataset
This module is used for selecting required columns, i.e. Pass/Fail is considered as target column & all other columns are used as predictor variables for model input.
Please note that we already removed Pre-room and Main-room temperature variables as they are used to build the target variable and hence not required in Model building activity.
● Split Data
We used 70% of total records to train model and rest 30% of data for testing. We later use Test data for understanding how model performs on Test data — measuring its accuracy and other performance parameters in later sections.
● Two Class Logistic Regression, Two Class Boosted decision trees
These two are difference algorithms applied simultaneously to compare which one provides best output.
● Train Model, Score Model & Evaluate Model.
Train Model initiates model training activity, thereby building a function inside which will explain at what parameters failure conditions are occurring. Score model provides it’s output so that we can compare actual Pass/Fail condition & model interpreted Pass/Fail conditions.
Evaluate model will simply evaluate how many times model is giving correct output — means when Machine is in Good condition, model is saying it’s in good condition & when Machine is in Bad condition model is also saying it’s in Bad conditions. These are called True Positive and True Negative conditions.
When Model is interpreting actual Good condition as Bad condition — it’s called as False Positive. When Model is interpreting actual Bad condition as Good condition — it’s called as False Negative. Both of these conditions are an error of model & Data Scientist team should focus on making these two errors as small as possible.
It is also important to note that we will never have both of these errors as 100% correct ideally — simple reason of which we cannot always provide model all data that is required. For example — we are not providing any data about other conditions of computer cooling, weather conditions, size/capacity of pressure pumps, maintenance times and all millions of other things which we will never know!
Machine Learning Models Output & Accuracy
We have used 3 models for Machine Learning. We will state reasons of using them & their benefits & their performance parameters.
1.Logistic Regression.
This algorithm is used when we have target column as binary or some classes. For example — Pass/Fail, True/Fail, Good/Better/Best etc. Algorithm use logarithmic theory for identifying various conditions when machine is in Good condition & Bad condition. Then it reduces those large conditions to optimum number of columns to make unique conditions of various sensors that explains Pass & Fail output.
The Yellow highlighted part is Evaluate Model which find out performance this Logistic regression model.
Below in Fig no are also provided its accuracy numbers.
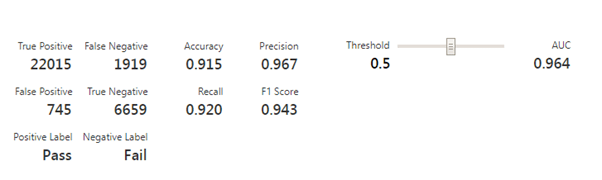
Accuracy of Model is 0.915 or 91.5%
Cases where model is giving correct output = True Positive + True Negative =22015+6659= 28674
Cases where model is giving wrong output = False Positive + False Negative =1919+745=2664
True Positive means machine is saying that condition is Good & model also predicts as Good. While True Negative means machine is saying that it’s condition is Bad & model also predicts as Bad.
False Negative means machine is saying that it’s condition is Good and model is giving output as Fail. This means we are getting false alerts from Model that Machine requires maintenance while actually it’s not required. Note that 1919 is a large number, that means we should find ways to decrease this number as it will waste lot of resources time at the end just to understand it’s a fake alert.
False Positive means machine is saying it’s condition is Bad however model is predicting as normal condition. Please note that 745 is large number of times it is providing False Positive alter.
2.Two Class Decision Tree Model
This algorithm is used when you need output in human readable form. It also gives better accuracy in some cases than Logistic Regression. Team has decided to build both models & compare its accuracy so that we can choose which fits best.
In below image Yellow highlighted part is evaluation module for Decision tree algorithm built.
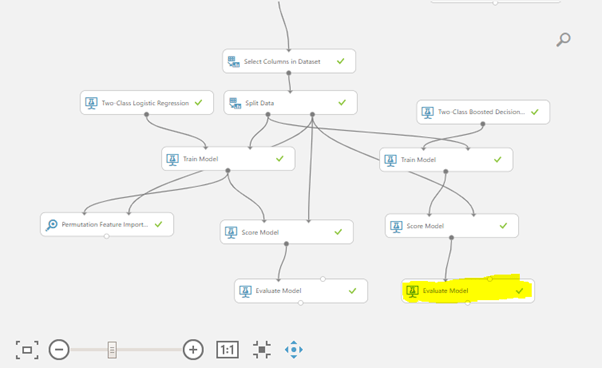
Right click on Evaluate Model, go to Evaluation Results and then Visualize.
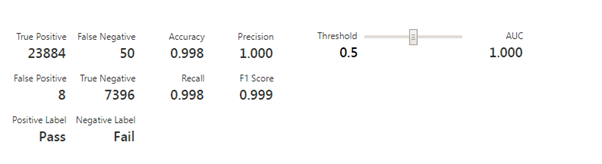
As you can see accuracy of Decision tree model is 0.998 or 99.8%.
You can compare number of False positives and False negatives ( 50 & 8 ) than Logistic Model ( 1919 & 754 ) . Hence this model is performing much better than earlier model & in long run we will stick with this Decision Tree algorithm for better accuracy.
Another benefit of Decision Tree model is that it gives us RULES when machine fails. This is most important for Business as we can identify where fault is occurring and take measures to reduce such failures.
BELOW ARE FAILURES CONDITIONS FOUND BY MACHINE LEARNING ALGORITHM:
There are 3 types of conditions of failures & below are conditions where these failures occur.
∙ Fail condition 1
1. Heiztemperatur.Wand.oben.rechts..ï…C >= 120.
2. Temp..RGA.1.HV.Schieber.PK..ï…C < 129.7
3. Temp..Reduzierung.Bypass..ï…C >= 60
4. Schwingungssensor..mm.s < 0.1099
5. Druck.Barion.XHV..mbar >= 0.0002389
∙ Fail Condition 2
1. Heiztemperatur.Wand.oben.rechts..ï…C >=120.
2. Temp..RGA.1.HV.Schieber.PK..ï…C >=129.7
3. Druck.RGA.1..mbar < 0 4.
4. Heiztemperatur.Tï…r.links..ï…C >=459.8
5. Schwingungssensor..mm.s >=0.08006
∙ Fail Condition 3
1. Heiztemperatur.Wand.oben.rechts..ï…C >=120.
2. Temp..RGA.1.HV.Schieber.PK..ï…C < 129.7
3. Temp..Reduzierung.Bypass..ï…C >=60
4. Schwingungssensor..mm.s < 0.1099
5. Druck.Barion.XHV..mbar < 0.0002389
6. Druck.Barion.XHV..mbar < 0
3.Time Series Machine Learning Model
We use another model to understand if there is natural factors involved in machine failures. This means weather, temperature, seasons (as we have complete full year data, Spring, Summer, Autumn and Winter) are impacting to machine or not. We also can see if machine is failing at regular intervals irrespective of other sensors state.
Based on understanding of data, model is predicted DOWNTIME intervals by month & date.
It helps Businesses to budgets their efforts, resource for machine maintenance and thereby reducing total cost of maintenance.
Don’t forget to give us your ? !


Predictive Maintenance: This Is How Machine Learning /AI can transform Manufacturing Industry —… was originally published in Becoming Human: Artificial Intelligence Magazine on Medium, where people are continuing the conversation by highlighting and responding to this story.
