A beginner’s guide to understanding the fundamental building blocks of deep learning platforms.
Originally from KDnuggets https://ift.tt/3knbY4r

365 Data Science is an online educational career website that offers the incredible opportunity to find your way into the data science world no matter your previous knowledge and experience.
Originally from KDnuggets https://ift.tt/3knbY4r
Originally from KDnuggets https://ift.tt/32DjjXs
Originally from KDnuggets https://ift.tt/2ZIWqA4
In this blog, I’m going to create a few ML models using Scikit-learn library and we’ll compare the accuracy for each of them.
For complete source code and dataset, you can visit my repository. (Link mentioned at the end of this blog).

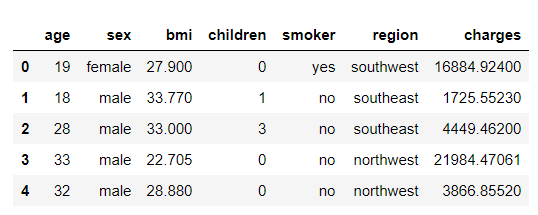
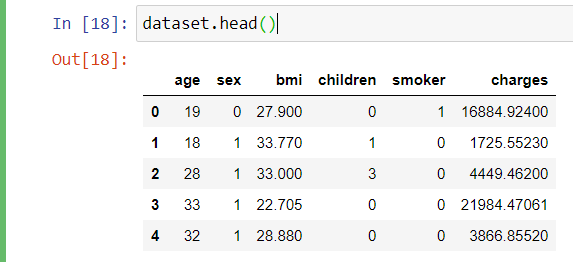
This dataset contains 7 features as shown below:
age: age of the policyholder
sex: gender of policyholder (female=0, male=1)
BMI: Body mass index, providing an understanding of the body, weights that are relatively high or low relative to height, objective index of body weight (kg / m ^ 2) using the ratio of height to weight, ideally 18.5 to 25
steps: average walking steps per day of the policyholder
children: number of children/dependents of the policyholder
smoker: smoking state of policyholder (non-smoke=0;smoker=1)
region: the residential area of the policyholder in the US (northeast=0, northwest=1, southeast=2, southwest=3)
charges: individual medical costs billed by health insurance.

This dataset is available in Kaggle. Click here to navigate to Kaggle website.
So let’s jump on coding.
Import necessary libraries
import numpy as np
import pandas as pd
import matplotlib.pyplot as plt
import seaborn as sns
Load Dataset
dataset = pd.read_csv(‘insurance.csv’)
Viewing the first 5 of the dataset
dataset.head()
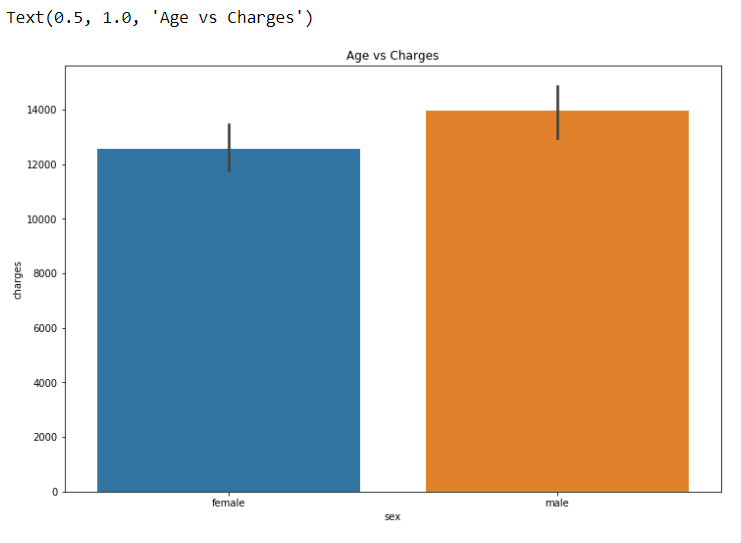
Plotting Bar Graph using all the features VS “Charges”
plt.figure(figsize = (12, 8))
sns.barplot(x = ‘sex’, y = ‘charges’, data = dataset)
plt.title(“Age vs Charges”)
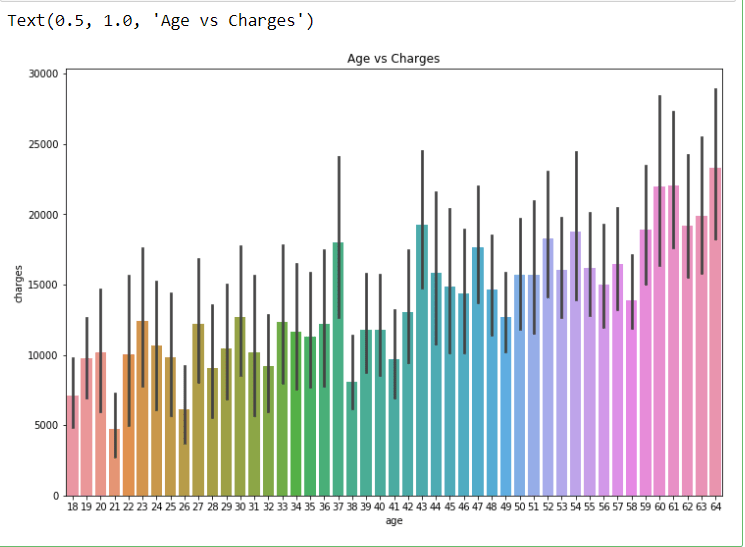
plt.figure(figsize = (12, 8))
sns.barplot(x = ‘age’, y = ‘charges’, data = dataset)
plt.title(“Age vs Charges”)
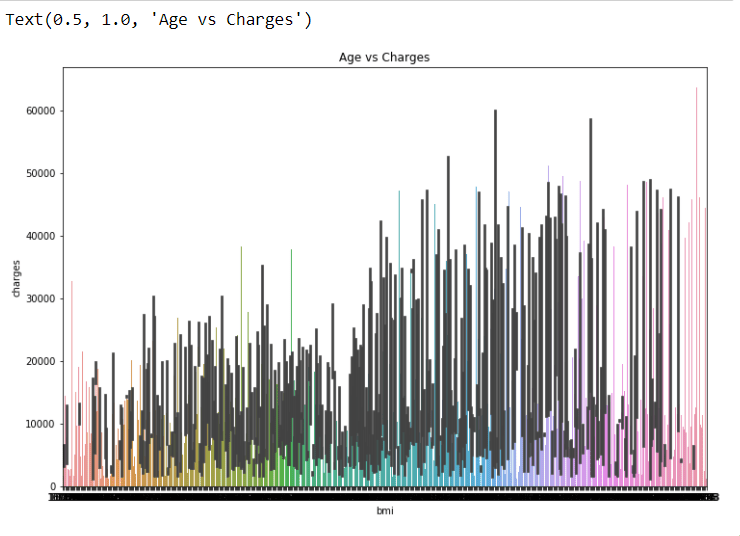
plt.figure(figsize = (12, 8))
sns.barplot(x = ‘bmi’, y = ‘charges’, data = dataset)
plt.title(“Age vs Charges”)
plt.figure(figsize = (12, 8))
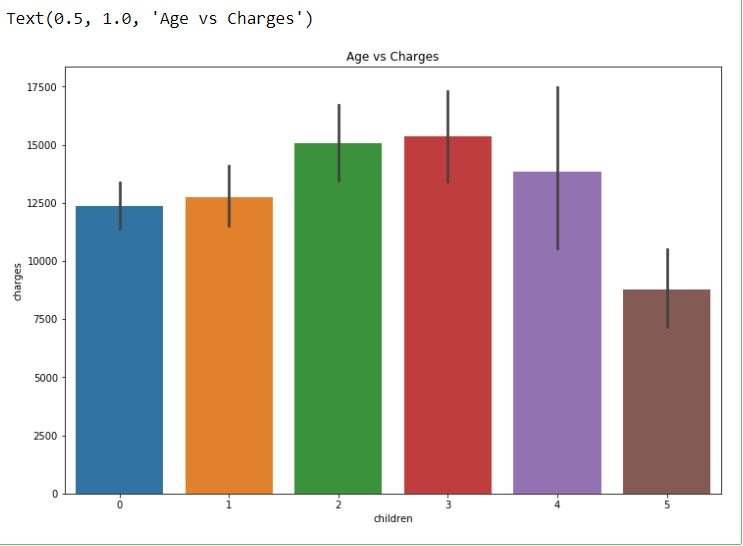
sns.barplot(x = ‘children’, y = ‘charges’, data = dataset)
plt.title(“Age vs Charges”)
plt.figure(figsize = (12, 8))
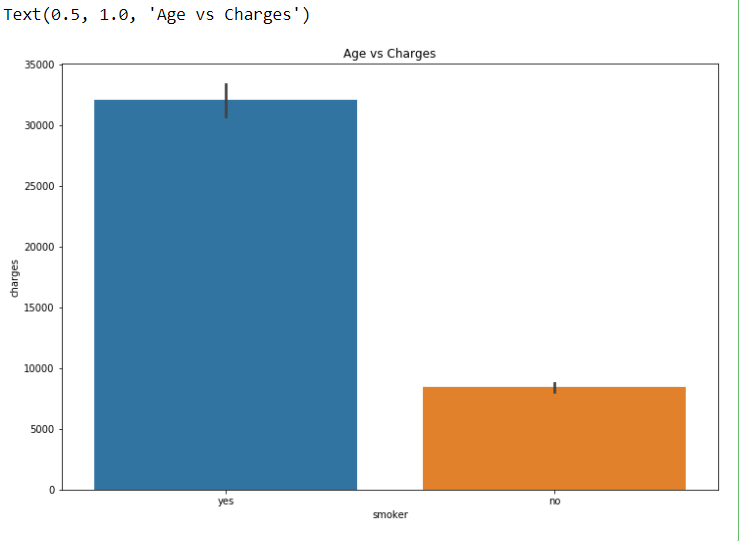
sns.barplot(x = ‘smoker’, y = ‘charges’, data = dataset)
plt.title(“Age vs Charges”)
plt.figure(figsize = (12, 8))
sns.barplot(x = ‘region’, y = ‘charges’, data = dataset)
plt.title(“Age vs Charges”)
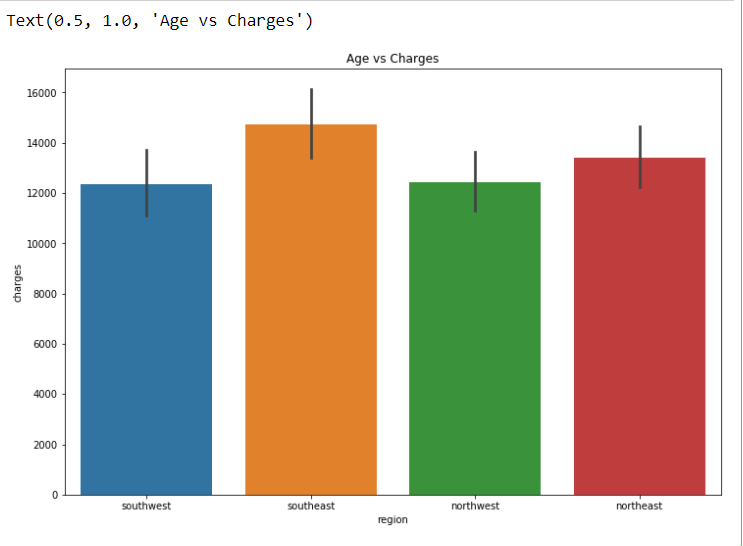
Here I feel we can drop one feature ie. “region” because it is not much important for prediction.
#Dropping least important feature of the dataset
dataset = dataset.drop(‘region’, axis = 1)
Label encoding for “sex” and “smoker”
from sklearn.preprocessing import LabelEncoder
le = LabelEncoder()
dataset[‘sex’] = le.fit_transform(dataset[‘sex’])
dataset[‘smoker’] = le.fit_transform(dataset[‘smoker’])
Assigning X and y
X = dataset.iloc[:,:5]
y = dataset.iloc[:,5]
print(X.shape)
print(y.shape)
Splitting Dataset into testing and training
from sklearn.model_selection import train_test_split
X_train, X_test, y_train, y_test = train_test_split(X, y, test_size = 0.2, random_state = 30)
Applying StandardScalar to X_train and y_test
from sklearn.preprocessing import StandardScaler
# creating a standard scaler
sc = StandardScaler()
# feeding independents sets into the standard scaler
X_train = sc.fit_transform(X_train)
X_test = sc.fit_transform(X_test)
Applying Linear Regressor Model
# Linear Regression
from sklearn.linear_model import LinearRegression
# creating the Linear Regression model
lR = LinearRegression()
# # feeding the training data to the model
lR.fit(X_train, y_train)
y_pred_lR = lR.predict(X_test)
lR.score(X_train,y_train)
>>0.7463716002316689
Applying Support Vector Machine Model
from sklearn.svm import SVR
# creating the model
svr = SVR()
# feeding the training data to the model
svr.fit(X_train, y_train)
# predicting the test set results
y_pred_svr = svr.predict(X_test)
svr.score(X_train,y_train)
>>-0.09361994960428022
Applying Random Forest Model
from sklearn.ensemble import RandomForestRegressor
regressor = RandomForestRegressor(n_estimators = 10, random_state = 0)
regressor.fit(X_train, y_train)
# Predicting a new result
y_pred = regressor.predict(X_test)
regressor.score(X_train,y_train)
>>0.9641035089873307
So we can notice that the Random Forest Model is predicting the best accuracy for our problem.
To access complete code click here. I request you all to work with this dataset can try to get better accuracy. You can connect with me on my social media mentioned below.
I hope you like this blog. Feel free to share your thoughts in the comment section and you can also connect with me in Linkedin.
Thank You.


Machine Learning Model For Predicting Insurance Claim Charge. was originally published in Becoming Human: Artificial Intelligence Magazine on Medium, where people are continuing the conversation by highlighting and responding to this story.

We are all aware of the fact that Data is going to rule humanity’s future. The knowledge of data and building intelligence using data is very important.
But learning Data Science can be intimidating at times. Firstly due to adverse complexity and learning curve. Secondly due to the wide range of resources.
Research suggests and I believe is that learning through questions can be a better way to challenge your understanding which also clears your concept. It is also very helpful for technical interviews.
I have collected questions from this very helpful resource. I would rate the difficulty level of the questions as pointed in the source article. Let’s begin:
Regression analysis is a statistical method to model the relationship between a dependent (target) and independent (predictor) variables with one or more independent variables.
For example, you buy a piece of land with some amount like $50000. It gets sold for $80000 after 3 years. Similarly, you buy more land for some prices. They get sold for some amount. Now we want to predict if we buy land for some amount what would be its cost after 3 years given the previous data. This is the work of regression.
Regression is a supervised learning technique that helps in finding the correlation between variables and enables us to predict the continuous output variable based on one or more predictor variables. It is mainly used for prediction, forecasting, time-series modeling, etc.
There are different types of Regression:
a. Linear Regression
b. Ridge Regression
c. Lasso Regression
d. Polynomial Regression etc
The description of the above types is another blog altogether. Let’s reserve it for another day.
Linear regression is a statistical regression method that is used for predictive analysis.
It is used for solving the regression problem in machine learning. Linear regression shows the relationship between the independent variable (X-axis) and the dependent variable (Y-axis), hence called the linear regression.
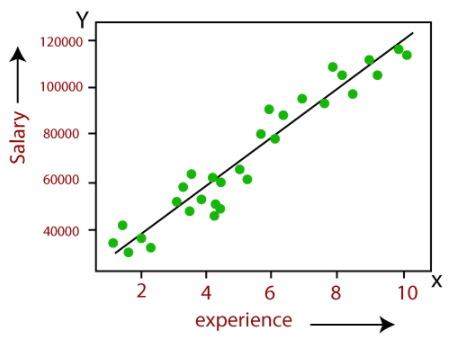
The above graph shows the relationship between employee salary and experience. Based on the above graph we can predict the employee salary if he has certain years of experience.
Linear regression is generally used in time-series forecasting, stock market analysis, investment profits analysis, weather forecasting, etc. Generally all the regression analyses in supervised learning.
The normal distribution or Gaussian distribution is a probability function that describes how the values of a variable are distributed. It is an asymmetric distribution where most of the observations cluster around the central peak and the probabilities for the values further away from the mean taper off equally in both directions. Extreme values in both tails of the distribution are similarly unlikely.
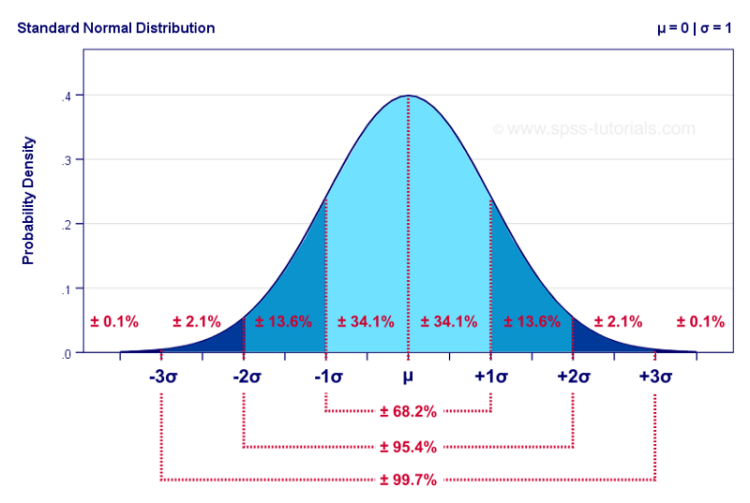
The normal distribution is the most important probability distribution in statistics because it fits many natural phenomena. For example, heights, blood pressure, measurement error, and IQ scores follow the normal distribution.
It also makes data science easy.
If we speak more statistically, the normal distribution is important because of the central limit theorem. It says that if we have a problem with several independent variables, the aggregate of those variables will tend towards a normal distribution.
4.1. Histograms
The first and foremost method is using a simple histogram. The histogram is a great way to quickly visualize the distribution of a single variable.
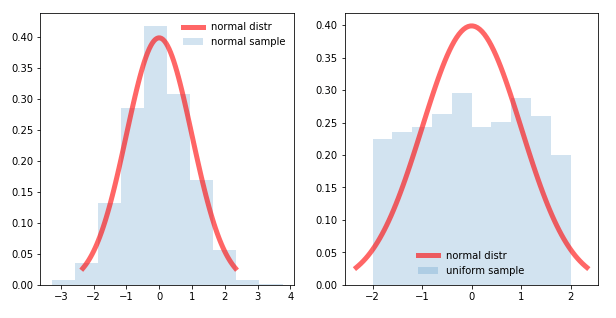
The left-hand side graph is normally distributed whereas the right-hand side graph isn’t normally distributed.
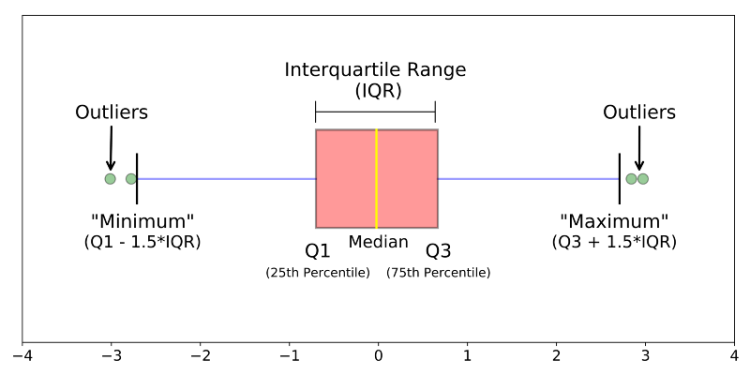
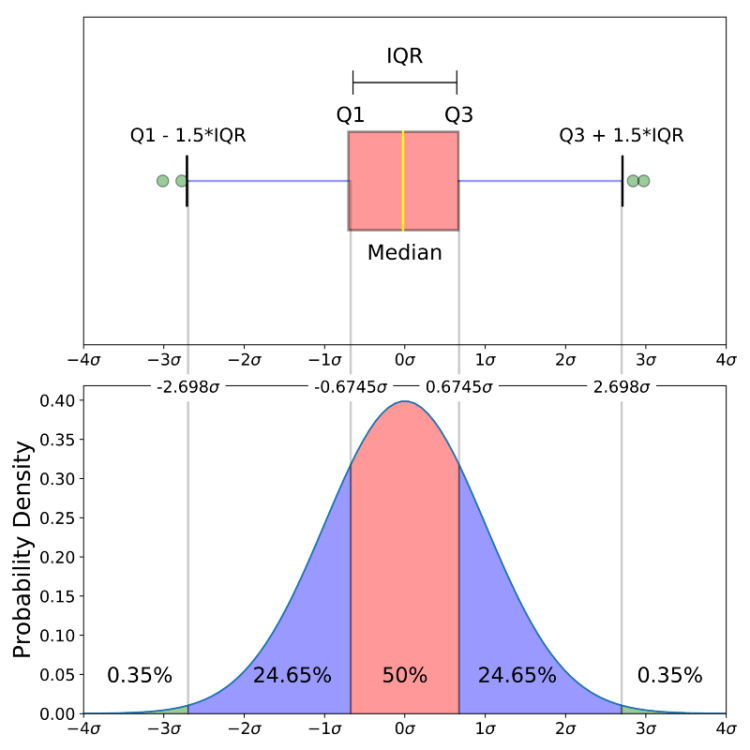
4.2. Box Plot
The Box Plot plots 5 number summary of a variable: minimum, first quartile, median, third quartile, and maximum. The boxplot is a great way to visualize distributions of multiple variables at the same time.
4.3. QQ Plot
QQ plot stands for quantile vs quantile plot. It generally plots theoretical plots against the actual quantiles of our variable.
The QQ plot allows us to see the deviation of a normal distribution much better than in a Histogram or Box Plot.
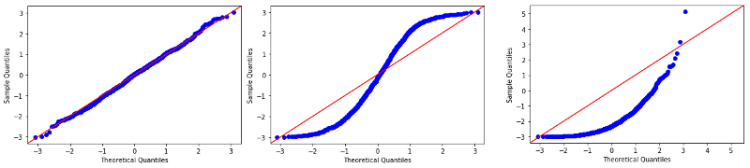
As seen in the above image, the following are the properties of the QQ plot.
There are many other tests. You can certainly give a look to this blog for more techniques.
First and foremost we would try to analyze the data. We try to visualize whether the data is normally distributed or not, does the data has outliers, whether the data is univariate or multivariate. The problem is a regression problem as the data of prices would be given and we have to predict the prices. So we can use algorithms like Linear Regression to solve this problem statement.
To understand whether the data is normally distributed or not we first normalize the data using sklearn’s standardscaler() or minmaxscaler() or we can simply code from scratch. Secondly, we can plot a histogram, if the data is of one single variable. We can also use the QQ plot if the data is of multiple variables.
As we have seen above we can do normal or standard scaling of the data and remove outliers in some cases to carry out our further processing.
I would come up with the second part of the “Data Science the smart way — Regression”. So please stay tuned.
You can read my other blogs: https://medium.com/@shamimio
Let’s connect on LinkedIn https://www.linkedin.com/in/shamimio/
Thank you for reading the blog.
Data Science the smart way: Regression was originally published in Becoming Human: Artificial Intelligence Magazine on Medium, where people are continuing the conversation by highlighting and responding to this story.

If you have a lot of image data to manage, then you know: identifying and avoiding duplicate images is the key to maintain the integrity of your image collection. Depending on which detection technique you choose, this can be error-prone or not applicable to large volumes of image data.
So, what is the best technique for detecting duplicate images? It always depends on your image collection and your requirements. How large is your collection? Do you want to detect exact duplicates only or also near-duplicates? Can the detection run in background or must it work in real-time?
Today, we’re going to show you five techniques to detect duplicate images, from simple to sophisticated. We hope this will help you to find the best approach for your image collection.
Only works if you have the naming scheme of the files under control.
The comparison of file names is obviously the easiest way to find duplicate images, but it can quickly become useless. Different images may have the same file name, and identical images in different folders may have different file names. Therefore, it’s important to control the naming scheme of your files if you want to use this simplest type of duplicate detection.
Can handle file identities very well, but the files must be binary equal.
A file hash is a fingerprint to identify files that have the identical binary content. Obviously, the file hash is more reliable than just the file name to detect duplicates because it represents the binary content of a file. Creating and comparing file hashes is very fast, therefore this technique can be easily applied to large image collections.
However, it cannot deal with any file modifications. In fact only a single changed bit in a file results in a different file hash. Image files with same pixel data do not have the same binary content when they are encoded in JPG or PNG format. Additionally, any differences to embedded metadata like EXIF or IPTC leads to a different file hash.
Good for finding exact duplicates or duplicates with tiny changes.
A perceptual hash tries to overcome the limitations of file hashes. Perceptual hashes are based on the pixel data and not their binary representation. While file hashing just can tell if files are identical or not, perceptual hashes can handle different file formats and file sizes. It’s fast to compute and lookup is as fast as with a file hash.
The possibility to calculate a distance between two perceptual hashes allows to detect not only identical images, but also close matches with tiny changes. Small differences in hashes reflect small differences in image content.
1. Microsoft Azure Machine Learning x Udacity — Lesson 4 Notes
2. Fundamentals of AI, ML and Deep Learning for Product Managers
However, the problem with perceptual hashing is that it can produce many false positive hits (images falsely recognized as duplicates). Perceptual hashes take neither image details nor the semantic meaning of an image into account. This can lead to similar looking images with completely different content being evaluated as duplicates.

Highly reliable in finding exact duplicates and near-duplicates with adjustable detection sensitivity.
Nowadays, deep learning techniques can produce an embedding from pixel data that can be used to identify duplicates just like a human being would look at images. An image can be detected as a duplicate even if it has another image size, file type or other modifications to its appearance (like brightness, gamma, saturation etc). Furthermore, the semantic content of the image can be considered to overcome the limitations of perceptual hashes.
For example, if you have an image of a red balloon and you search for duplicates using perceptual hashes all types of somehow red in the middle images (tomato, red ball, strawberry) may be detected as duplicates. The deep learning embedding will stay in the context of balloons.
Using embeddings as representation of images allows you to detect near-duplicate images and to control the detection sensitivity. This is why our duplicate detection uses this technique.
Excellent for finding near-duplicates and parts of images, but not suitable in real-time operation.
All detection techniques mentioned above calculate one fingerprint to represent the complete image. But if you want to find images where a part of an image is used, the interest point technique is what you need.
Instead of creating a single embedding representing the complete image, this technique identifies interest points (significant regions of an image like corners), and creates an embedding for each region. When searching for duplicates the embeddings of all interest points and their relative positions are compared to another image. If a certain amount of embeddings and their relative positions occur in two images, they are considered duplicates. This allows to identify near-duplicates as well as images that contain only some cropped part of the search image.

Since an image is represented by hundreds of embeddings and they all have to be compared, this technique is several orders of magnitude slower than using a single embedding to represent an image.
Therefore, this technique can be applied for background processing tasks that run overnight, rather than real-time use cases where you try to detect duplicates before they enter your system.
Regardless of the technique you use, it is necessary to take action after duplicate content is detected. Depending on the type of your image collection and the image management platform you use or provide, different strategies can be applied and may make sense for you or your users. Here are some examples from our practical experience:
If you need support in realizing the recognition of image duplicates in your system, please contact us.
Originally published on https://pixolution.org/blog
What Is The Best Technique to Detect Duplicate Images? was originally published in Becoming Human: Artificial Intelligence Magazine on Medium, where people are continuing the conversation by highlighting and responding to this story.
Originally from KDnuggets https://ift.tt/3ko3kTk
Originally from KDnuggets https://ift.tt/2FGXugM
Originally from KDnuggets https://ift.tt/33x7DVw
Originally from KDnuggets https://ift.tt/2ZI4QaR
