In this article, we will talk about a Do-It-Yourself approach towards election analysis and coming to a conclusion whether the elections were conducted fairly or not.
Originally from KDnuggets https://ift.tt/32xgDdV

365 Data Science is an online educational career website that offers the incredible opportunity to find your way into the data science world no matter your previous knowledge and experience.
Originally from KDnuggets https://ift.tt/32xgDdV
I’m a recently graduated engineer with a degree in artificial intelligence. As a computer scientist, I am motivated largely by my curiosity of the world around us and seeking solutions to its problems.
I am also counting on you to send me comments that will help me improve the quality of the articles and improve myself.
I invite you to follow me on instagram @frenchaiguy and on GitHub.
In the previous article, we talked about the different areas of computer vision. I strongly encourage you to read it if you haven’t already done to fully understand object detection.
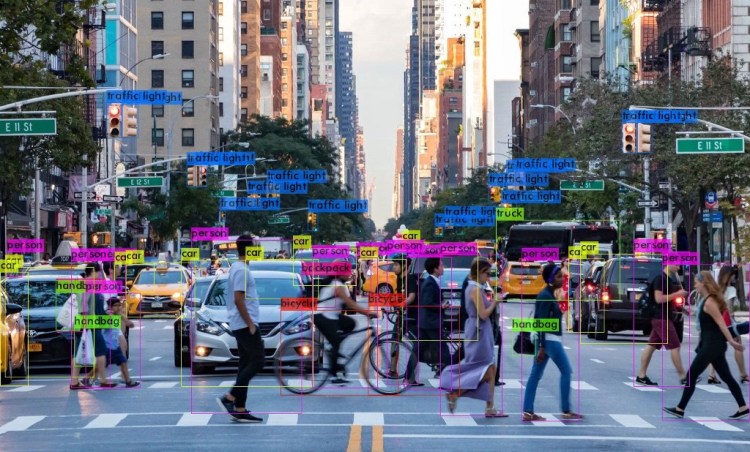
Today we are going to talk about object detection, a branch of computer vision, a field that is widely used in self-driving cars to detect pedestrians or signs etc…
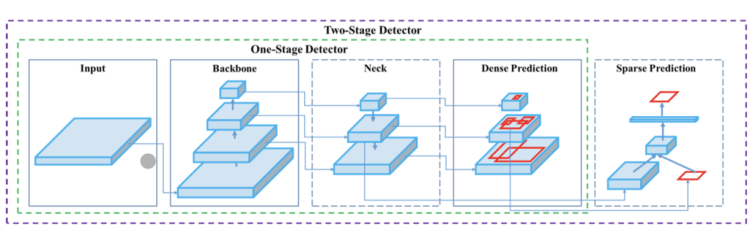
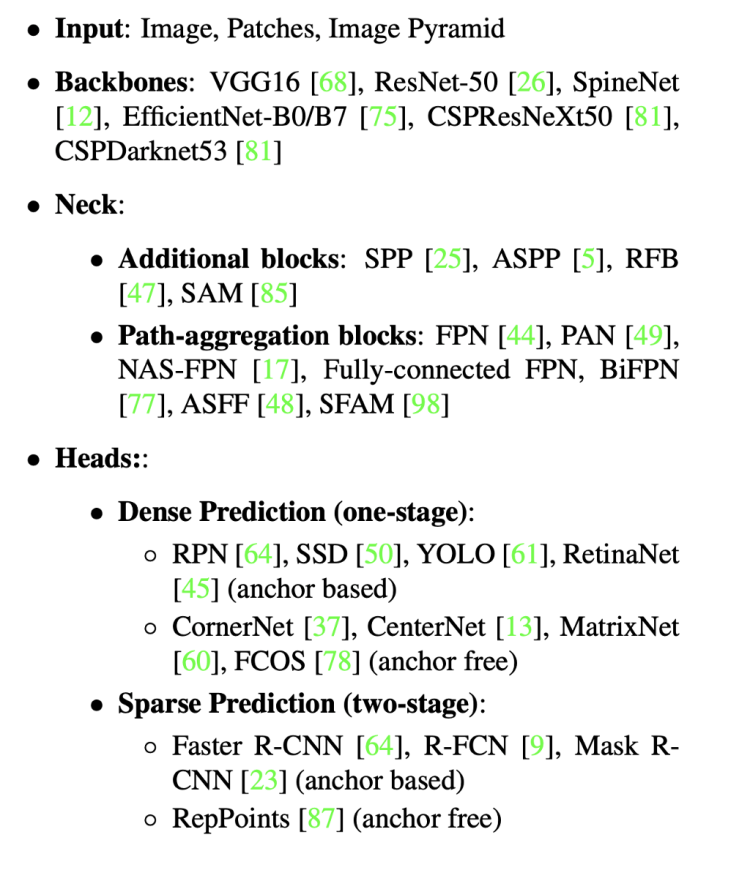
There are two types of object detection models, one stage or two stage models. A one stage model is capable of detecting objects without the need for a preliminary step. On the contrary, a two stage detector uses a preliminary stage where regions of importance are detected and then classified to see if an object has been detected in these areas. The advantage of a one stage detector is the speed it is able to make predictions quickly allowing a real time use.

YoloV4 is an important improvement of YoloV3, the implementation of a new architecture in the Backbone and the modifications in the Neck have improved the mAP(mean Average Precision) by 10% and the number of FPS(Frame per Second) by 12%. In addition, it has become easier to train this neural network on a single GPU.
We are going to detail all the layers of YoloV4, to understand how it works..
What’s the backbone for? It’s a deep neural network composed mainly of convolution layers. The main objective of the backbone is to extract the essential features, the selection of the backbone is a key step it will improve the performance of object detection. Often pre-trained neural networks are used to train the backbone.
The YoloV4 backbone architecture is composed of three parts:
We are going to explain all these concepts in the following parts.
Bag of freebies methods are the set of methods that only increase the cost of training or change the training strategy while leaving the cost of inference low. Let’s present some simple methods commonly used in computer vision.
Data augmentation
The main objective of data augmentation methods is to increase the variability of an image in order to improve the generalization of the model training.
1. Microsoft Azure Machine Learning x Udacity — Lesson 4 Notes
2. Fundamentals of AI, ML and Deep Learning for Product Managers
The most commonly used methods are Photometric Distortion, Geometric Distortion, MixUp, CutMix and GANs.
Photometric distortion
Photometric distortion creates new images by adjusting brightness, hue, contrast, saturation and noise to display more varieties of the same image.

In the example above we adjusted the Hue(or color appearance parameter) to modify the image and create new samples to create more variability in our training set.
Geometric distorsion
The so-called geometric distortion methods are all the techniques used to rotate the image, flipping, random scaling or cropping.

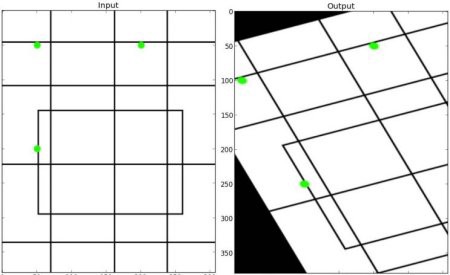
In the first example (i.e. figure 4), we rotated the original image by 90°. In the second example (i.e. figure 5), we performed an affine transformation of the original image.
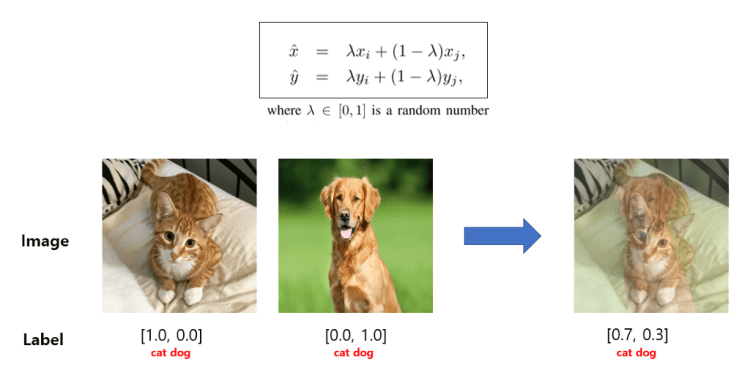
MixUp
Mixup augmentation is a type of augmentation where in we form a new image through weighted linear interpolation of two existing images. We take two images and do a linear combination of them in terms of tensors of those images. Mixup reduces the memorization of corrupt labels, increases the robustness to adversarial examples, and stabilizes the training of generative adversarial networks.
In mixup, two images are mixed with weights: λ and 1−?. λ is generated from symmetric beta distribution with parameter alpha. This creates new virtual training samples.
In image classification images and labels can be mixed up as following:
CutMix
CutMix augmentation strategy: patches are cut and pasted among training images where the ground truth labels are also mixed proportionally to the area of the patches. CutMix improves the model robustness against input corruptions and its out-of-distribution detection performances.

Bag of freebies for fight against bias
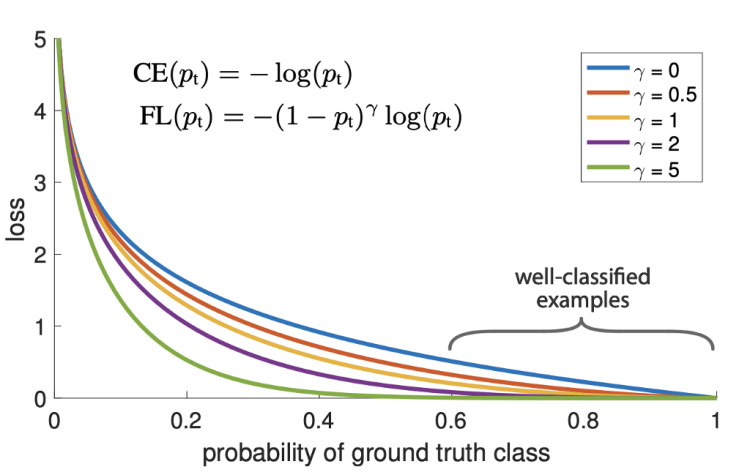
Focal loss
The Focal Loss is designed to address the one-stage object detection scenario in which there is an extreme imbalance between foreground and background classes during training (e.g., 1:1000).
Usually, in classification problems cross entropy is used as a loss function to train the model. The advantage of this function is to penalize an error more strongly if the probability of the class is high.
Nevertheless, this function also penalizes true positive examples these small loss values can overwhelm the rare class.
The new Focal loss function is based on the cross entropy by introducing a (1-pt)^gamma coefficient. This coefficient allows to focus the importance on the correction of misclassified examples.
The focusing parameter γ smoothly adjusts the rate at which easy examples are down-weighted. When γ = 0, FL is equivalent to CE, and as γ is increased the effect of the modulating factor is likewise in- creased
Label smoothing
Whenever you feel absolutely right, you may be plainly wrong. A 100% confidence in a prediction may reveal that the model is memorizing the data instead of learning. Label smoothing adjusts the target upper bound of the prediction to a lower value say 0.9. And it will use this value instead of 1.0 in calculating the loss. This concept mitigates overfitting.
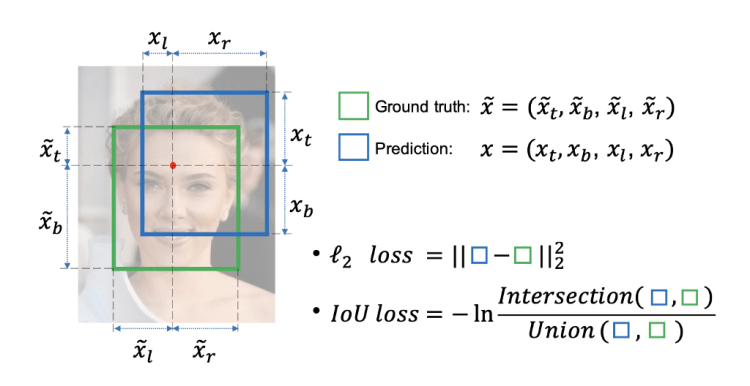
IoU loss
Most object detection models use bounding box to predict the location of an object. To evaluate the quality of a model the L2 standard is used, to calculate the difference in position and size of the predicted bounding box and the real bounding box.
The disadvantage of this L2 standard is that it minimizes errors on small objects and tries to minimize errors on large bounding boxes.
To address this problem we use IoU loss for the YoloV4 model.
Compared to the l2 loss, we can see that instead of optimizing four coordinates independently, the IoU loss considers the bounding box as a unit. Thus the IoU loss could provide more accurate bounding box prediction than the l2 loss. Moreover, the definition naturally norms the IoU to [0, 1] regardless of the scales of bounding boxes
Bag of special methods are the set of methods which increase inference cost by a small amount but can significantly improve the accuracy of object detection.
Mish activation
Mish is a novel self-regularized non-monotic activation function which can be defined by f(x) = x tanh(softplus(x)).
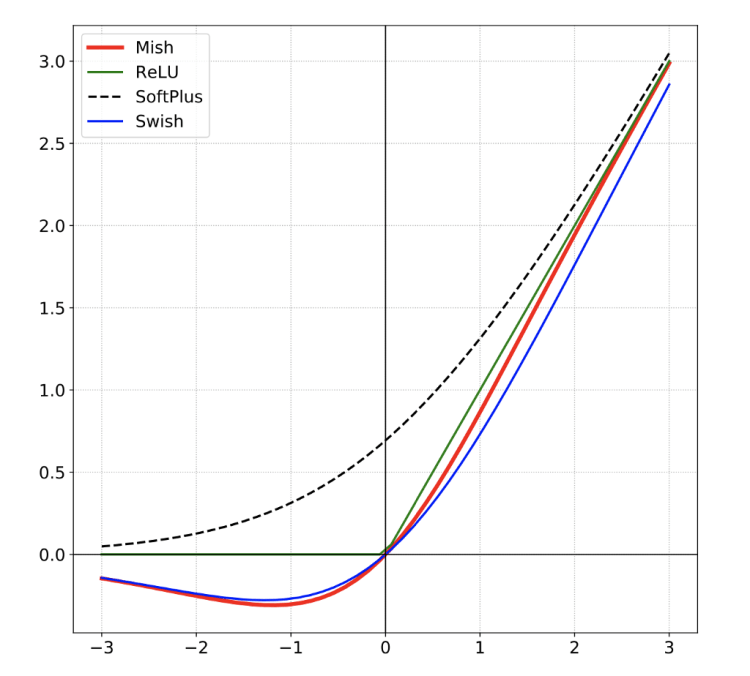
Why this activation function improve the training ?
Mish is bounded below and unbounded above with a range of [≈ -0.31,∞[. Due to the preservation of a small amount of negative information, Mish eliminated by design the preconditions necessary for the Dying ReLU phenomenon. A large negative bias can cause saturation of the ReLu function and causes the weights not to be updated during the backpropagation phase making the neurons inoperative for prediction.
Mish properties helps in better expressivity and information flow. Being unbounded above, Mish avoids saturation, which generally causes training to slow down due to near-zero gradients drastically. Being bounded below is also advantageous since it results in strong regularization effects.
The Cross Stage Partial architecture is derived from the DenseNet architecture which uses the previous input and concatenates it with the current input before moving into the dense layer.
Each stage layer of a DenseNet contains a dense block and a transition layer, and each dense block is composed of k dense layers. The output of the ith dense layer will be concatenated with the input of the ith dense layer, and the concatenated outcome will become the input of the (i + 1)th dense layer. The equations showing the above-mentioned mechanism can be expressed as:
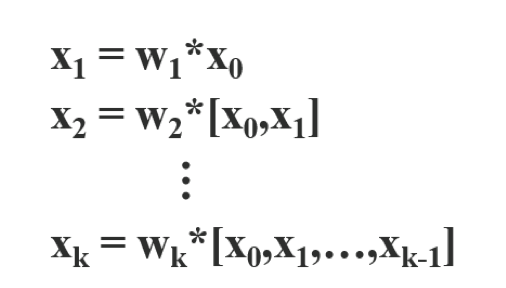
where ∗ represents the convolution operator, and [x0, x1, …] means to concatenate x0, x1, …, and wi and xi are the weights and output of the ith dense layer, respectively.
The CSP is based on the same principle except that instead of concatenating the ith output with the ith input, we divided the input ith in two parts x0′ and x0’’, one part will pass through the dense layer x0’’, the second part x0′ will be concatenated at the end with the result at the output of the dense layer of x0’’.
This translates mathematically into the following equation:
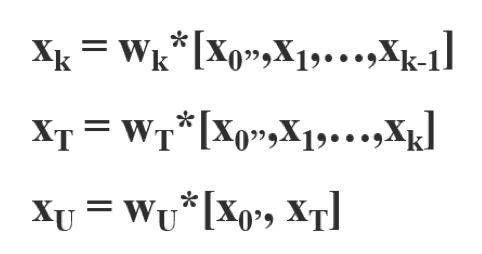
This will result in different dense layers repeatedly learn copied gradient information.
The essential role of the neck is to collect feature maps from different stages. Usually, a neck is composed of several bottom-up paths and several top-down paths.
We will explain the different elements that make up the neck of the yoloV4 is their usefulness in architecture.
What is the problem caused by CNN and fully connected network ?
The fully connected network requires a fixed size so we need to have a fixed size image, when detecting objects we don’t necessarily have fixed size images. This problem forces us to scale the images, this method can remove a part of the object we want to detect and therefore decrease the accuracy of our model.
The second problem caused by CNN is that the size of the sliding window is fixed.
How SPP runs ?
At the output of the convolution neural networks, we have the features map, these are features generated by our different filters. To make it simple, we can have a filter able to detect circular geometric shapes, this filter will produce a feature map highlighting these shapes while keeping the location of the shape in the image.
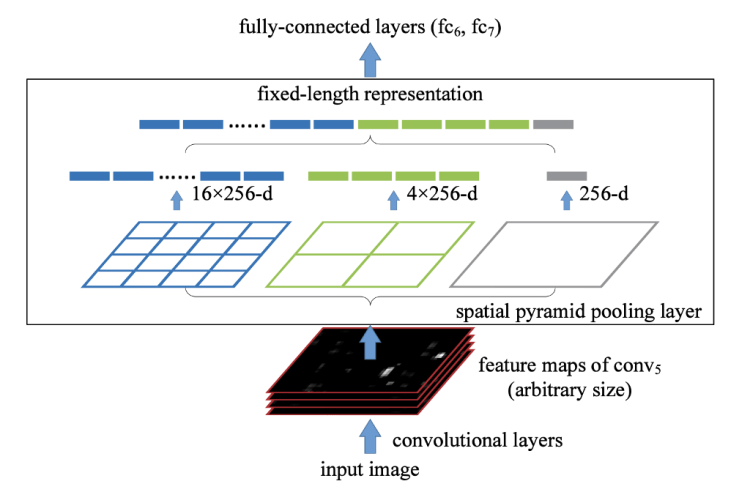
Spatial Pyramid Pooling Layer will allow to generate fixed size features whatever the size of our feature maps. To generate a fixed size it will use pooling layers like Max Pooling for example, and generate different representations of our feature maps.
I will detail the different steps carried out by an SPP.
In the case of Figure 13, we have a 3-level PPS. Suppose the conv5 (i.e. the last convolution layer) has 256 features map.
What are the benefits of SPP ?
In the early days of deep learning, simple networks were used where an input passed through a succession of layers. Each layer takes input from the previous layer. The early layers extract localized texture and pattern information to build up the semantic information needed in the later layers. However, as we progress to the right, localized information that may be needed to fine-tune the prediction may be lost.
To correct this problem, PaNet has introduced an architecture that allows better propagation of layer information from bottom to top or top to bottom.
The components of the neck typically flow up and down among layers and connect only the few layers at the end of the convolutional network.
We can see in figure 14, that the information of the first layer is added in layer P5 (red arrow), and propagated in layer N5 (green arrow). This is a shortcut to propagate low level information to the top.
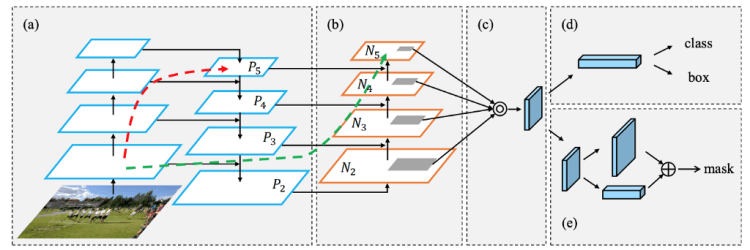
How PaNet add information to top layers ?
In the original implementation of PaNet, the current layer and information from a previous layer is added together to form a new vector. In the YoloV4 implementation, a modified version is used where the new vector is created by concatenating the input and the vector from a previous layer.

The role of the head in the case of a one stage detector is to perform dense prediction. The dense prediction is the final prediction which is composed of a vector containing the coordinates of the predicted bounding box (center, height, width), the confidence score of the prediction and the label.
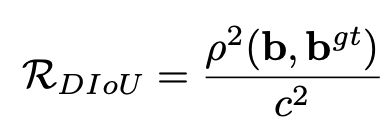
CIoU-loss
The CIoU loss introduces two new concepts compared to IoU loss. The first concept is the concept of central point distance, which is the distance between the actual bounding box center point and the predicted bounding box center point.
The second concept is the aspect ratio, we compare the aspect ratio of the true bounding box and the aspect ratio of the predicted bounding box. With these 3 measures we can measure the quality of the predicted bounding box.
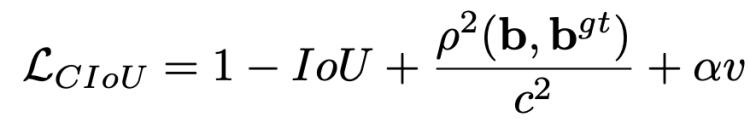
where b and bgt denote the central points of B and Bgt, ρ(·) is the Euclidean distance, c is the diagonal length of the smallest enclosing box covering the two boxes, α is a positive trade-off parameter, and v measures the consistency of aspect ratio.
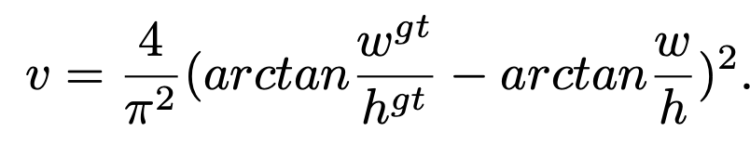
where w is the height of the bounding box and w is the width.
CmBN (Cross mini Batch Normalization)
Why use Cross mini Batch Normalization instead of Batch Normalization? What are its advantages and how does it work? We will answer these questions in this paragraph.
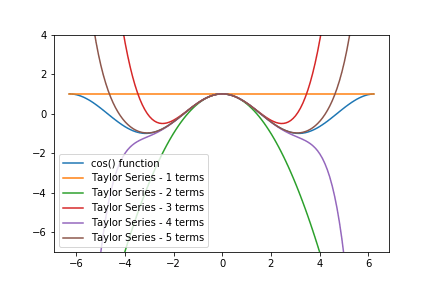
Batch Normalization does not perform when the batch size becomes small. The estimate of the standard deviation and mean is biased by the sample size. The smaller the sample size, the more likely it is not to represent the completeness of the distribution. To solve this problem, Cross mini Batch Normalization is used, which uses estimates from recent batches to improve the quality of each batch’s estimate. A challenge of computing statistics over multiple iterations is that the network activations from different iterations are not comparable to each other due to changes in network weights. To solve this problem, Taylor polynomials are used to approximate any indefinitely differentiable function.

Let’s take the example of the cosine function, let’s note f(x) = cos(x), we will look for an approximation of this function in the neighbourhood of 0. We use Taylor’s formula at order 2:
f(x) = f(x0) + f’(x0)(x-x0) + (1/2)f’’(x0)(x-x0)
= 1 — x/2
We can see on figure 19(curve green), that this approximation in the neighbourhood of 0 is pretty good, nevertheless the further we move away the more the quality of the approximation decreases, we can go to higher orders to improve the quality of the approximation.
Now back to Batch Normalization, the classic way to normalize a batch is as follows:
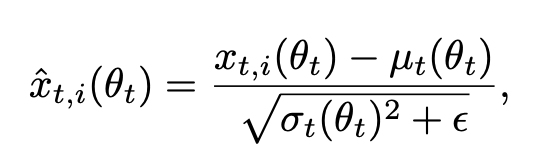
where ε is a small constant added for numerical stability, and μt(θt) and σt(θt) are the mean and variance computed for all the examples from the current mini-batch.
The cross mini Batch Normalization is defined as follows:
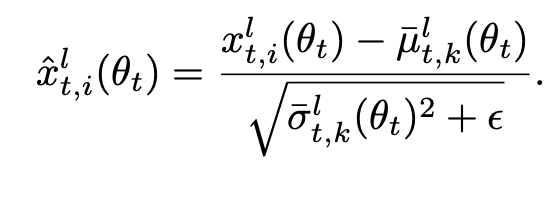
where the mean and variance are calculated from the previous N means and variances and approximated using Taylor formulae to express them as a function of the parameters θt rather than θt-N.
DropBlock regularization
Neural networks work better if they are able to generalize better, to do this we use regularization techniques such as dropout which consists in deactivating certain neurons during training. These methods generally improve accuracy during the test phase.
Nevertheless the dropout drops features randomly, this method works well for fully connected layers but is not efficient for convoluted layers where features are spatially correlated.
In DropBlock, features in a block (i.e. a contiguous region of a feature map), are dropped together. As DropBlock discards features in a correlated area, the networks must look elsewhere for evidence to fit the data.
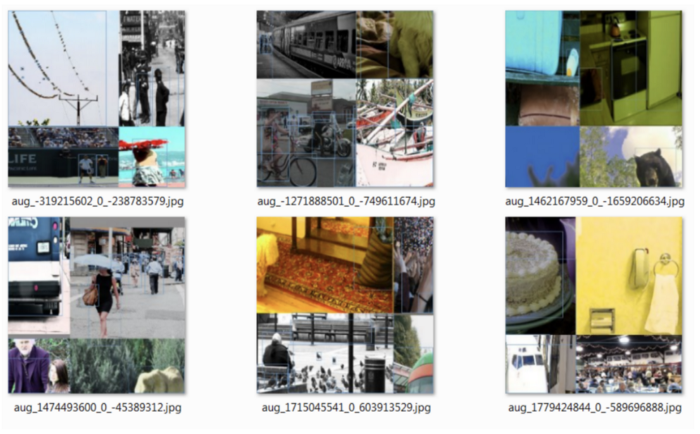
Mosaic data augmentation
Mosaic data augmentation combines 4 training images into one in certain ratios. This allows for the model to learn how to identify objects at a smaller scale than normal. It also encourages the model to localize different types of images in different portions of the frame.
Self-Adversarial Training (SAT)
Self-Adversarial Training (SAT) represents a new data augmentation technique that operates in 2 forward backward stages. In the 1st stage the neural network alters the original image instead of the network weights. In this way the neural network executes an adversarial attack on itself, altering the original image to create the deception that there is no desired object on the image. In the 2nd stage, the neural network is trained to detect an object on this modified image in the normal way with original label before add noise to the image.
eliminate grid sensitivity
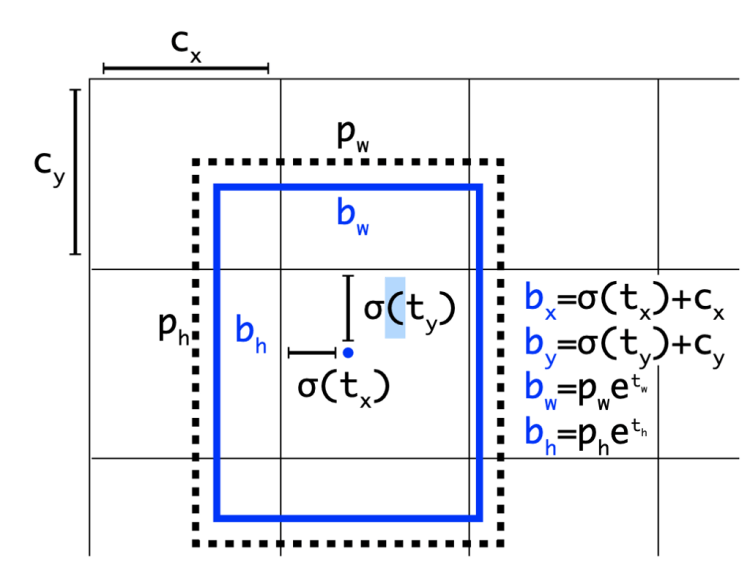
Eliminate grid sensitivity the equation bx = σ(tx)+ cx,by =σ(ty)+cy, where cx and cy a real ways whole numbers, is used in YOLOv3 for evaluating the object coordinates, therefore, extremely high tx absolute values are required for the bx value approaching the cx or cx + 1 values. We solve this problem through multiplying the sigmoid by a factor exceeding 1.0, so eliminating the effect of grid on which the object is undetectable.
Using multiple anchors for a single ground truth
We predict several boxes, because it is difficult for a convolution network to predict directly a set of boxes associated with objects of different ratio, that’s why we use anchors that divide the image space according to different strategies.
From the features map created by the convolution layers, we create many anchor boxes of different ratios in order to be able to represent objects of any size, we then decide thanks to the IOU to assign some boxes to an object or a background according to the threshold below.
IoU (truth, anchor) > IoU threshold (formula)
Cosine annealing scheduler
A cosine function is used to update the learning rate, the advantage of the cosine function is that it is cyclic allowing to get out of the local minima more easily than the step method or SGD.

The learning rate will decrease until the end of the cycle, then it will suddenly increase abruptly allowing to possibly extract itself from a local minimum. If the function to be optimized is not convex, then starts to decrease slowly again, by choosing the number of cycles we can thus avoid local minimums.

Optimal hyper- parameters
To try to find the best hyperparameters, genetic algorithms are used to find the most suitable parameters. N randomly selected parameters are initialized. Then we train N models, select the K best models, then we choose random parameters derived from the K best models and we train N2 new models and we start again until we reach the final iteration.
Random training shapes
Many single-stage object detectors are trained with a fixed input image shape. To improve generalization, we can train the model with different image sizes. (Multi-Scale Training in YOLO)
Mish activation
See previous part
SAM-block
Layers of attention are very common in deep learning essentially in language processing, they are found in the latest state of the art models.
In the case of Yolo the attentions are used to highlight the most important features created by the convolution layers and remove the unimportant ones.
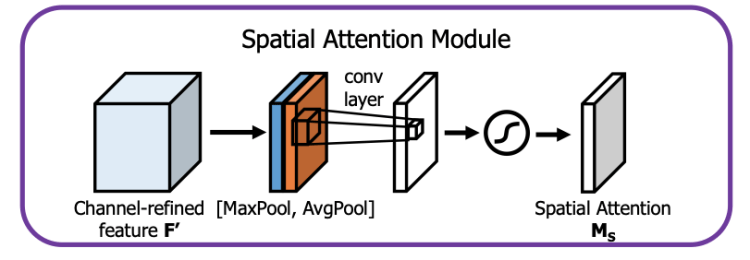
SAM simply consists of applying two separate transforms to the output feature map of a convolutional layer, a Max Pooling and an Avg Pooling. The two features are concatenated and then passed in a convoluted layer, before applying a sigmoid function that will highlight where the most important features are located.
For YoloV4, we use a modified version of SAM (figure 27) where the layers of Max Pooling and Avg Pooling have been removed.

DIoU-NMS
NMS (Non-Maximum Suppression) is used to remove the boxes that represent the same object while keeping the one that is the most precise compared to the real bounding box.
where b and bgt denote the central points of B and Bgt, ρ(·) is the Euclidean distance, and c is the diagonal length of the smallest enclosing box covering the two boxes.
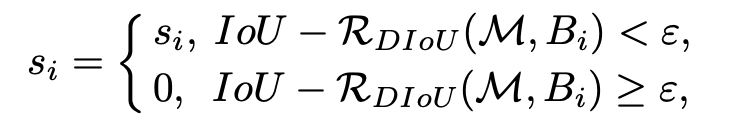
We test if the overlap rate minus the distance between the two centers is lower than the threshold ε, if this is the case we keep the bounding box, otherwise we delete it.
As you can see there are many layers to build an object detection model. For YoloV4, the researchers decided to make the best compromise between the mAP and the training and inference speed of the model allowing its use in embedded devices. Nevertheless, with the rise in power of mobile chips that are becoming more and more economical with integrated GPUs specially designed for deep learning processing, it is possible to envisage other architectures for the future.
In the next post, I will talk about the detection of traffic signs with YoloV4, an application used in self-driving car.
Stay tuned


Explaining YoloV4 a one stage detector was originally published in Becoming Human: Artificial Intelligence Magazine on Medium, where people are continuing the conversation by highlighting and responding to this story.

This is the second part of my series which focus on Big Data Analytics, if this is your first time I recommend you read my first article here which will introduce you to the Big data analytics.
A framework is a real or conceptual structure intended to serve as a support or guide for the building of something that expands the structure into something useful. Example In computer systems, a framework is often a layered structure indicating what kind of programs can be built and how they would interrelate.
Why do we need a framework for data analytics?
In data analytics, the framework allows you to move through data analysis in an organized way. It provides you with a process to follow as you scrutinize the data with your teams to identify and solve problems.
Imagine having a data-focused project with your team and start working on that project. If you’re not using a framework, there’s a good chance that different people will use different approaches to solve the same problem. Having different approaches will make it difficult to make a decision at different stages of your project and can be difficult to trace it back.
The framework will allow you to focus on the business outcomes first and the actions and decisions that enable the outcomes. It helps you to focus on attention on what generates value first before examining all the data that are available or data that are not available that needs to be procured.
As a data scientist of a data analyst, you might ask yourself “what analytic techniques can I use and what tools can help me to analyze my data”?. There are four types of data analytics, and the tools used to help build analysis: Descriptive analytics, Diagnostic analytics, Predictive Analytics, and Prescriptive analytics.
The choice of an analytical approach based on what do you want to get or know from the data. This ranges from whether you want to identify a problem, propose a solution to solve problems, provide recommendations or actions that should be taken in the future.
1.Descriptive Analytics
This helps you understand the current state of affairs in an organization. It lets you look at what is happening today and what has happened in the past. This type of analytics typically provides summarized information to understand currently existing sales patterns or customer behavior, customer profitability, past competitor actions, etc.
Specific techniques might include simple box plots, histogram charts with means, minimums, and maximums. Plotting the data in quartiles or deciles across a number of different variables. Or computing statistical measures like mean, mode, standard deviation, etc.
Descriptive analytics is very powerful for understanding the current state of affairs and for developing the hypothesis to anticipate where business problems and opportunities may lie.
2.Diagnostic Analytics
This provides the reasons for what happened in the past. This type of analytics typically tries to go deeper into a specific reason or hypotheses based on descriptive analytics.
While descriptive analytics cast a wide net to understand the breadth of the data, diagnostic analytics goes deep into the costs of issues.
3.Predictive Analytics
Unlike descriptive or diagnostic analytics, predictive analytics is more forward-looking. Predictive analytics lets you envision what could happen in the future. This type of analytics can help the client answer questions like, what are my customers likely to do in the future? What are my competitors likely to do? What will the market look like? How will the future impact my product or service?.
Predictive analytics typically predicts what could happen based on the evidence we have seen.
1. Microsoft Azure Machine Learning x Udacity — Lesson 4 Notes
2. Fundamentals of AI, ML and Deep Learning for Product Managers
(4) Prescriptive Analytics
This goes beyond providing recommendations to actually executing the actions or taking the decisions that are right for a particular situation. It does this by looking at what happened in the past, the present state and all the future possibilities.
Prescriptive analytics provides answers to the question, what steps or interventions need to be taken(what is the solution) to achieve the desired outcomes? Often the intervention might be an optimal solution given the circumstances. Or the best possible action given the uncertainty in the environment and the limited information available.
Prescriptive analytics is powerful in understanding the right actions needed today to address future possibilities and put an organization in the best possible position to take advantage of future conditions.
So how can a company/organization apply this technique to solve their business problems? Let us take a look at the following case study.
The following case study will help you understand how different organizations and companies can apply Data analytics framework to reach their decision and increase the number of customers and revenues.
This is not going to be a complete one to one mapping but nevertheless to the extent that those connections exist it will help frame for you how the different levels of the analytics framework work and how the business practices and business strategy is changing as you move up.
General Electric Company

It is a large global company, it was founded more than a hundred years ago(1892) and it does many many things. General Electric makes light bulbs, health care stuff, energy stuff, windmills, gas turbines, jet engines, transportation equipment, railroad equipment and so on.
The use of data brought evaluation to General Electric company, about how data from industrial internet or internet obtain sources, sensors and so on are changing business, changing strategies, changing business practices, changing the management of talent in this environment and just completely revolutionizing business in some sense. Let’s look at the evolution of General Electric over the past several decades.
1.Transactional Model
During the 1980s General Electric was selling different products to its customers such as light bulbs, jet engines, windmills, and other related products. Also, they separately sell parts and services this means they would sell you a certain product you would use it until it needs repair either because of normal wear and tear or because it’s broken. And you would come back to GE and then GE would sell you parts and services to fix it. This was a transaction model during the time.
There’s not much in the space of relationships and it’s one of the transactions of sales and services.
2.Contractual Model
Then in the 1990s till about the 2010s GE started moving to it’s more of a contractual model where they would guarantee the performance of their products. Example they will sell you a windmill, but GE will guarantee that the windmill work for 90% of the time over the course of one year. And they give you a condition under which it would work and they will tell you what they would do if the uptime is less than 90% and so on.
Now it’s no longer just a transactional relationship, where GE sells you the piece of equipment and then GE walks away. During this Model, GE has to engage with the client to work on operating, maintaining, doing preventative maintenance on the piece of equipment.
To be able to guarantee this level of performance it requires deeper engagement but also deeper analytics.
3.Expanded Customer Outcome Model
During this model, GE not only guaranteeing uptime but GE is going to help its clients make the best use of equipment that’s has been sold to them.
Example GE now says that well okay, we sold this equipment, we have sensors and devices on this equipment to figure out or to compute their operating parameters to get their operational details, from that we can do an analytics to then actually tell you(client) how best to operate all of the equipments to maximize the value.
So for instance if the client has bought a whole series of windmills, when to let the windmills run, when is the wind too high that you just have to let the windmills spin freely, when do you schedule the maintenance across the different units so that overall the power output remains steady but you’re also maintaining, keeping up the lifetime of all of those windmills and so on.
So really partnering at an even deeper level with the client, to get the client to maximize their value.
1. Descriptive and Diagnostic Analysis
The Transactional Model for GE was focusing on how much GE was selling, in sales of operational equipment, and in sales of parts and services. And what does GE need to do to drive up those sales. So in terms of analytics, GE needed to perform descriptive and diagnostic analytics in order to increase its sales of equipment, parts, and services.
2. Predictive Analytics
During the level of the contractual model, GE would guarantee the performance of its equipments sold to their clients. Now they need to go into the level of predictive analytics.
GE needs to predict when stuff will fail so that they can do preventive maintenance. They need to be able to predict how to operate this equipment so that it will actually stay up for 90% of the time. Finally, performance guarantees take GE to the level of predictive analytics.
3. Prescriptive Analytics.
The last model for GE is expanded customer outcomes, this is at the level of prescriptive analytics. GE’s truly telling the client(s) how they should use the equipment to maximize the value. Much more value for the client this is also much harder to do because GE needs to collect a lot of more data, analyze it a lot more carefully.
This has changed the business model because GE is actually selling not just the equipments, parts and services, GE is selling the analysis that means GE is going to be charging money for this partnership where GE can tell its clients how best to operate the equipment. So this is actually generating more value for both GE and for the clients.
By using Big data and analytics to identify emerging trends, organizations will be able to create new service offerings for their consumers. And new business models who execute them.
Using data and analytics isn’t limited to only high tech industries. Whatever sector you operate in, be it finance, healthcare, education, Insurance, Transportation, Sports, Energy, Media, Manufacturing, retail, or just about anything else, big data and analytics can and will play a critical role. Therefore, organizations using big data solutions need to keep up with its evolving nature while those still reluctant to invest should rethink their organizational policies.
If you learned something new or enjoyed reading this article, please clap it up ? and share it so that others will see it. Feel free to leave a comment too.
Understand Data Analytics Framework with a case study in the business world was originally published in Becoming Human: Artificial Intelligence Magazine on Medium, where people are continuing the conversation by highlighting and responding to this story.
The world of sport is filled with superstition. Michael Jordan famously wore University of North Carolina shorts under his Chicago Bulls kit; Serena Williams wears the same socks throughout a tournament; and when Goran Ivanisevic won a tennis match, he would repeat that day’s activities throughout the competition.
Psychologists say this behavior comes about because the human brain sometimes links events that have little or no causal connection. Computer scientists have a different way of thinking about it. For them, this is an example of “overfitting” — using irrelevant detail to construct a model. There may be many factors that contribute to the success of a particular tennis shot or basketball throw or home run but the color of socks or underpants is probably not one of them.
Exactly the same thing occurs with artificial neural networks. The networks learn relevant detail but also irrelevances. Indeed, overfitting is the bane of machine learning experts who have devised a wide range of techniques to get around it.
All of this begs the question of how the human brain deals with overfitting. Our day-to-day experience can be hugely repetitive, so how does the brain generalize from these singular experiences to other situations?
Today, we get an answer thanks to the work of Erik Hoel, a neuroscientist at Tufts University in Massachusetts. Hoel’s answer is that the human brain prevents overfitting by dreaming. He says dreaming evolved specifically to deal with this problem, which is common to all neural networks. If his theory is correct, it answers one of the great unsolved problems in neuroscience: why we dream at all.
First, some background. Psychologists, neuroscientists and others have pondered the origin and role of dreams for time immemorial. Freud suggested that they were a way of expressing frustrations associated with taboos — an idea that has long been discredited.
1. Microsoft Azure Machine Learning x Udacity — Lesson 4 Notes
2. Fundamentals of AI, ML and Deep Learning for Product Managers
Others have suggested dreams are a kind of emotional thermostat that allow us to control and resolve emotional conflicts. However, critics point out that most dreams lack strong emotional content and that emotionally neutral dreams are common.
Still others say dreams are part of the process the brain uses to fix memories or to selectively forget unwanted or unneeded memories. These theories also come up against the criticism that most dreams lack realistic detail, have a strange hallucinatory quality and often contain never-before-seen sequences. “Most dreams do not involve specific memories at all, making the integration of new memories a questionable purpose for dreaming,” says Hoel.
His new idea is that the purpose of dreams is to help the brain to make generalizations based on specific experiences. And they do this in a similar way to machine learning experts preventing overfitting in artificial neural networks.
The most common way to tackle overfitting is to add some noise to the learning process, to make it harder for the neural network to focus on irrelevant detail. In practice, researchers add noise to images or feed the computer with corrupted data and even remove random nodes in the neural network, a process known as dropout.
In human terms, this would be equivalent to forcing Michael Jordan to wear different combinations of shorts or making Serena Williams change her socks or Goran Ivanisevic adopting random routines on game days. This would make it much less likely that they would focus on a specific irrelevant detail.
Dreams perform the same function for the brain, says Hoel: “The purpose is to provide ‘out-of-distribution’ simulations specifically to prevent overfitting and improve generalization.”
He calls this idea the overfitted brain hypothesis and points out that there is plenty of evidence in its favor. For example, one of the best ways to trigger dreams is to embark on extensive sessions playing simple repetitive games such as Tetris. This creates the conditions in which the brain can become overfitted to task.
That’s why this kind of activity triggers dreams. These dreams are not replays of remembered Tetris games but tend to be sparse on detail with hallucinatory qualities. It is this “noise” that helps the brain generalize from the game. That’s also why people can improve their performance after a good night’s sleep.
Hoel uses his new theory to make a number of testable predictions. “It may be that direct measurement of overfitting is possible in humans,” he says. For example, one approach might be to train people in overly repetitive tasks and to see whether they can generalize this behavior, with and without sleep.
The theory could also be used to better understand the types of mistakes that sleep-deprived individuals are likely to make and then to mitigate against these. “If it is true that sleep-deprived brains are overfitted, they will be prone to make errors in stereotypical ways,” he says.
Hoel says the theory suggests a way to treat sleep deprivation. “There is also the possibility of dream substitutions, wherein artificial dream-like stimuli might help improve generalization and therefore performance in sleep-deprived individuals,” he says.
The nature of dream substitutes is itself fascinating. Hoel says that fiction in general — books, plays, films etc — might perform a similar role to dreams. “They are, after all, explicitly false information,” he points out.
Just why humans create and enjoy fiction has always been something of a puzzle. But Hoel has an answer: “The overfitted brain hypothesis suggests fictions, and perhaps the arts in general, may actually have an underlying cognitive utility in the form of improving generalization and preventing overfitting, since they act as artificial dreams.”
That’s interesting work! Until now, most cognitive theories treat dreams as an epiphenomenon, an amusing by-product of sleep with no significant function of its own.
Hoel’s ideas turn all this upside down by providing a biological function for dreams and hence a rationale for their evolution for the first time.
Time for nap!
How Artificial Neural Networks Paved the Way For A Dramatic New Theory of Dreams was originally published in Becoming Human: Artificial Intelligence Magazine on Medium, where people are continuing the conversation by highlighting and responding to this story.
Originally from KDnuggets https://ift.tt/3c1pLuD
Originally from KDnuggets https://ift.tt/32uD9nC
Originally from KDnuggets https://ift.tt/3ivEtMK
Originally from KDnuggets https://ift.tt/3huS3hZ
Originally from KDnuggets https://ift.tt/33sJteB
Convolutional neural networks used to detect objects in images rely on convolution operations. Although the convolution operation is…
Continue reading on Becoming Human: Artificial Intelligence Magazine »
