365 Data Science is an online educational career website that offers the incredible opportunity to find your way into the data science world no matter your previous knowledge and experience.
Even though transformers for NLP were introduced only a few years ago, they have delivered major impacts to a variety of fields from reinforcement learning to chemistry. Now is the time to better understand the inner workings of transformer architectures to give you the intuition you need to effectively work with these powerful tools.
You’ve seen their Big Bad NLP Database and The Super Duper NLP Repo. Now Quantum Stat is back with its most ambitious NLP product yet: The NLP Model Forge.
What Are the Best Public Datasets for Machine Learning?
In this day and age, the aspiration to automate and improve human related tasks with the help of computers is at the forefront.
Today, this is mostly done through artificial intelligence (AI) and machine learning (ML).
These topics may seem complicated at first, especially if you’re just getting started in the field.
But, in reality, it is not that difficult to get into that part of data science. All you need is practice.
And, in order to practice your machine learning skills, you need to train your models with data.
Lots of data.
Luckily, there is plenty of it available on the Internet for free. Yet still, you may be wondering where to begin and which of the thousands of machine learning datasets to choose.
So, to help you get off to a good start, we have selected the 10 best free datasets for machine learning projects. We made sure the list we compiled covers all main topics of machine learning. Moreover, the projects get progressively more difficult as you go through the list. This way you can gradually improve your skills as you practice.
Let’s get started, shall we?
Top 10 Public Datasets for Machine Learning
1. Boston House Price Dataset
The Boston House Price Dataset consists of the house prices in Boston area based on numerous factors, such as number of rooms, area, crime rates and many others. It is a perfect starting point for beginners to ML looking for easy machine learning projects, as you can practice your linear regression skills in order to predict what the price of a certain house should be. It is also a very popular machine learning dataset, so if you get stuck, you can find a lot of helpful resources about it online.
2. Iris Dataset
The Iris dataset is another dataset suitable for linear regression, and, therefore, for beginner machine learning projects. It contains information about the sizes of different parts of flowers. All these sizes are numerical, which makes it easy to get started and requires no preprocessing. The objective is pattern recognition – classifying flowers based on different sizes.
3. MNIST dataset
The MNIST dataset is the most popular dataset in Machine Learning. Practically everyone in the field has experimented on it at least once.
It consists of 70,000 labeled images of handwritten digits (0-9). 60,000 of those are in the training set and 10,000 in the test set. The images themselves are 28×28 pixels and are in grayscale (meaning each pixel has 1 numeric value – how “white” it is). They have been heavily sanitized and preprocessed, so you don’t have to do much preprocessing yourselves.
The popularity of this dataset stems from its ease of use and flexibility. Given the small size of the images you don’t have to worry much about training times, so you can experiment a lot with it. Coupled with the preprocessing, this makes it very smooth and fast to get started with. In addition, this dataset allows for many different models to work well. So, if you are a beginner, you can use the straightforward linear classifier, however, you can also try and practice a deeper network. Given that the input is images, this is a perfect playground for learning Convolutional Neural Networks (CNN). Overall, we encourage everyone to give this dataset a try.
4. Dog Breed Identification
The previous entry in our list (MNIST) was a transitional dataset from feed forward neural networks to Computer Vision. This one, Dog Breed Identification, is now firmly in the Computer Vision field. It is, as the name suggests, a dataset of images of different dog breeds. Your objective is to build a model that given an image can accurately predict which breed it is. So, you can transfer the CNN skills you obtained from the MNIST dataset and build upon them.
5. ImageNet
ImageNet is one of the best Machine Learning datasets out there, focused on Computer Vision. It has more than 1,000 categories of objects or people with many images associated with them. It even ran one of the biggest ML challenges – ImageNet’s Large-Scale Visual Recognition Challenge (ILSVRC), that produced many of the modern state-of-the-art Neural Networks.
So, if you want to do Computer Vision, you will need this dataset.
6. Breast cancer Wisconsin diagnostic dataset
The Breast Cancer Wisconsin diagnostic dataset is another interesting machine learning dataset for classification projects is the breast cancer diagnostic dataset. Its design is based on the digitized image of a fine needle aspirate of a breast mass. In this digitized image, the features of the cell nuclei are outlined. For each cell nucleus, ten real-valued features are calculated, i.e., radius, texture, perimeter, area, etc. There are two types of predictions – benign and malignant. In this database, there are 569 instances which include 357 benign and 212 malignant.
7. Amazon Reviews Dataset
We are now entering the territory of Natural Language Processing (NLP). This is recommended for more advanced machine learning enthusiasts.
The Amazon Review Dataset includes reviews (ratings, text, helpfulness votes), product metadata (descriptions, category information, price, brand, and image features), and links (also viewed/also bought graphs). The data spans more than 20 years of reviews.
8. BBC News
Continuing with NLP, this time we have text classification, or more precise news classification. So, to develop your news classifier, you need a standard dataset. The BBC News dataset contains more than 2,200 articles in different categories, and it is your job to try and classify them.
9. YouTube Dataset
Now we have arrived to an even more advanced topic – video classification. The YouTube dataset containing uniformly sampled videos with high-quality labels and annotations.
10. Catching Illegal Fishing
This final dataset for machine learning projects is for the experts.
There are many ships and boats in the oceans, and it is impossible to manually keep track of what everyone is doing. That is why, it has been suggested to develop a system that can identify illegal fishing activities through satellite and Geolocation data. Witch the Catching Illegal Fishing dataset, The Global Fishing Watch is offering real-time data for free, that can be used to build the system.
That was Our List of Public Datasets for Machine Learning Projects
Bear in mind, that we have included interesting data sets for all skill levels and many different parts of machine learning research, however, there might be other, more specific datasets that also work for you.
Machine Learning for Beginners
You already have a good dataset for machine learning but don’t know how to use it? Well, in that case you can explore our machine learning and deep learning courses that are part of the 365 Data Science program. There, you can learn all the skills necessary to tackle the projects outlined in the list above.
Traditionally, success in the music industry has always been closely associated with touring, sold CDs, and charts. With the rapid digitization of our world, the music industry has moved to a new way of measuring success — data. With so much information about music at hand, data science consulting companies like Iflexion can build specialized solutions to identify which songs a particular person will like, predict the next big music star, and craft songs to suit a very specific target audience.
How Data Shapes Sound
As much as underground communities, genre gatekeepers, music critics and art enthusiasts would love it to change, the music industry has been heavily commercialized. Commercial artists’ task here is to create music that will satisfy big audiences and make a profit. When data used wisely, artists can write songs that will more than likely appeal to a particular audience.
One of the most prominent data advocates in the music industry, Ankit Desai, has once looked at streaming statistics of Swedish artist Tove Lo. He noticed that one of her songs was particularly popular among EDM fans. Desai advised to capitalize on this opportunity to win a bigger market, and two months later, Love To released a song featuring EDM artist Alesso. The song went platinum in a number of countries and made it to the top of The Billboard’s US Dance Club Songs chart.
Big Data jobs
How Data Made Spotify Superior
With 286 million active users and a nearly 40% share of the global music streaming market, data is a critical factor of Spotify’s worldwide success.
What sets Spotify apart from competitors is its powerful recommendation service. Each Monday, every user receives a customized ‘Discover Weekly’ playlist that is comprised of 30 songs specifically selected for every user. Such an extreme level of personalization is possible because Spotify acquired at least six music recommendation and machine learning-related companies including Niland, Sonalytic, Seed Scientific, and The Echo Nest.
Currently, Spotify uses a combination of these three recommendation models:
– Collaborative modeling. Spotify’s machine learning model constantly analyzes what type of music you currently like by evaluating your actions towards particular songs. For example, the algorithm takes into consideration which songs you’ve played on repeat, added to the playlist, etc. Then, Spotify compares your music preferences to other users, finds those with similar tastes, and recommends songs they like to you.
– Natural Language Processing. After scanning a track’s metadata (artist name, song title, etc.) Spotify’s NLP model scans thousands of articles, forums, blog posts, and discussions about an album or a song on the internet. The algorithm analyzes what language people use to describe the song and matches them with other songs that are discussed in a similar manner.
– Convolutional Neural Networks. Spotify uses a CNN-based model to analyze raw audio data regarding the song’s BPM, musical key, loudness, and other parameters. Spotify then finds songs with similar parameters and recommends it to you. This model has proven to be exceptionally effective for discovering quality music that is yet to be recognized by the masses.
How AI Lowers the Music Industry’s Entry Barrier
A great song is a combination of one’s creative spark and others’ technical knowledge. You would be surprised how much it takes to transform a dry and lifeless recording into what you hear on the radio or a streaming service. The process of optimizing a track for an adequate listening experience is called mastering. For many up and coming artists, everything related to audio processing is the biggest roadblock on their way to releasing music, as professional mixing and mastering services usually cost more than they can afford.
This is where AI comes into play. For example, LANDR is an ML-powered online service that can master a track in a few minutes. LANDR’s algorithm took thousands of professionally mastered songs as a blueprint and now matches audio qualities of those songs to the uploaded ones.
Similarly, Soundcloud, one of the most popular free online music streaming platforms among independent artists, has also introduced an online mastering tool powered by ML. Currently, there are many AI-assisted audio plugins and tools that help less tech-savvy creators produce music of high sound quality.
How Data Helps Discover New Talent
In 2018, Warner Music Group acquired Sodatone, a service that feeds streaming, social media, and touring data into ML algorithms to identify which artists have the most potential to become successful in the future. This year, Amazon patented its own technology that can predict the future popularity of various media content including music, books, and films.
Hitlab, a Canadian digital media and AI company, aims to be the major tool for AI-driven A&R. Music Digital Nuance Analysis (DNA) is a patented tool that helps break down any song into 83 attributes. The tool can analyze the most popular songs in any region and then compare their attributes to any newly released song to identify the ‘hit’ potential. This can become a secret weapon of modern-day producers, songwriters, labels, and publishers as now they can tailor their sound to appeal to a specific target audience.
Will A&R professionals become obsolete? In short, definitely not. As in most other AI use cases, the technology here will become more of an assistant. With 20,000 songs uploaded to Spotify every day, the scouting job becomes increasingly difficult. Such tools will only help narrow those thousands of songs to a hundred, significantly easing the A&R job.
It is hard to imagine life without social media. The fast-paced life leaves little room to stay physically connected, that’s where social media helps. The reach of social media has grown from the way we interact to the way we market products, to how we manage our personal lives. And for businesses, social media has become a formative factor for success.
Today, before a product reaches the consumer it is first launched on Twitter, Instagram, and Facebook. Increase sales on Instagram, Facebook and Twitter while also increasing followers are some of the things that online marketers aim for. So to get long term results, it is best to optimize social media.
According to an online estimate, more than 3.5 billion people use social media that equate to about 45% of the world population. More than 90% of millennials use social media, which is followed by Gen X which make about 77% of it.
On average, every person spends about 3 hours per day on messaging platforms and social media networks. And more than 73% of marketers believe in the power of social media networks.
The impact of positive customer experience on social media is about 71%. About 49% of consumers depend on influencer recommendations on various social media platforms. More than 91% users access social media sites using mobile devices.
Big Data jobs
Most social media platforms use AI technology as a key component. AI therefore, works behind the scenes to power the world’s most popular social media sites. This is why social media platforms use newer technologies and updates for connective user engagement.
Facebook uses advanced machine learning technology to target users with ads and facial recognition in posts.
Instagram uses AI to identify different visuals. Snapchat uses AI to track features and overlay that helps to move your face in real-time.
LinkedIn uses AI technology for job recommendations and serving specific posts on your feed.
Let’s look into how AI is making social media more useful:
AI helps to measure the performance, track and analyze every move on social media that includes the recital, user engagement, and insight. The brands therefore get a clear picture of what the customers want and their respective choices. AI keeps track of search history and purchase patterns. Performance metrics play the basis for search engine optimization as well.
Integration with AI allows social media marketers to understand the preferences of the audience and get a step closer to them. This helps in both targeting of ads and creating the right content for social media.
AI can help you to seek real-time interactions with leads. Social media can get you immediate attention so you can use AI as a social media-monitoring tool.
AI offers impeccable customization for various social media platforms with its ability to analyze user profiles accurately and also hyper-personalize the entire user experience. It is a well known fact that consumers are more likely to respond to personalized marketing messages. According to an Accenture report, 43% of people are more likely to make purchases when the user experience is personalized
Content creation and content marketing play an important role in social sites. With the power of AI softwares you can know which content targeting will yield maximum results and ways to disperse it. This results in speeding the process of creating and producing certain types of content for social media platforms.
Social media sites often use AI-powered chatbots that help in offering faster response rate to consumer queries while reducing the workload. Chatbots are programmed with set answers which are provided as automatic replies to frequently asked questions for the specific social media features. Chatbots are cost-effective and a ‘human way’ to stay in touch.
The face recognition feature of AI helps to tag suggestions on Facebook. It helps to search for buying patterns, search patterns, and complete online presence. Facebook also utilizes the data to generate buying suggestions for people.
AI is makingselling on Instagrameasy — AI-powered tools can help brands to create new social media posts and figure out which posts work the best. AI-powered tools can measure trends and brands across Instagram. It can decrease management time and write social ads.
AI for Pinterest works on a deep learning algorithm. It is based on neutral networking which simply means the image on the platform is attached to a neural network based on the theme.
AI decreases the cost and increases the revenue; it enhances the efficacy of social media content. AI tools can help with publishing, scheduling, uploading shares, and pulling relevant links in hashtags on different social media sites.
AI integration is thus one of the most important strategies to streamline online operations, user experience and enhance user engagement.
5 ways to incorporate AI into your social media strategy:
1. Know About Insight and React
When Social sites are integrated with a proper AI platform, customer data insights come into play. It allows listening to consumers, discovering emerging trends, tracking brand reputation, and searching for new audiences to target.
The scale of social media is ginormous and AI can help in analysing the post faster and accurately. Thus it becomes easier for digital marketers to understand how this segmented data can be used for increasing user engagement and identify newer avenues for online promotion.
2. Social Management with Machine Learning
Machine learning is a concept-driven modern AI that can help make future predictions based on historical data. It then leverages the insight that is collected from user data to help auto-generate social media content across multiple channels.
The technology automatically includes short links and hashtags. Social media management with machine learning saves a lot of time as well.
3. Proactive Feature with Emotion AI
AI-powered sentiment analysis’s tool also known as emotion AI uses natural language processing to identify the negative and positive words on social media posts. This gives the brands a clearer idea as to how their customers react and feel towards their service and products. With the information, the brands and companies can proactively reach out to customers and solve their complaints.
4. Streamline Communication with Chatbots
Chatbots is a valuable AI tool through which the company or brand can streamline communication. Chatbots normally conduct conversations via textual or auditory methods.
Through Chatbots, the companies will be able to facilitate communication in both offline and online mode. Chatbot tool is useful in the world of instant gratification and response.
Social media influencing has become a powerful tool for brand awareness and increasing sales. AI integration has developed a world’s first digital supermodel known as Shudu. It’s 100% computer generated and has more than 200K followers on social media. It is an innovative venture for brands and companies to connect with new clients or target audience.
To Conclude,
AI-powered tools can dramatically increase your social media reach. The tools can help to create different social media posts and figure out which social media posts will work the best depending on customer behavior.
It measures brands across different social platforms. It also decreases time and costs across various social media platforms.
With new updates and technology, AI-centric tools increase your social media reach. It is time to optimize your resources and get great success in business.
Artificial intelligence or AI performs better cognitive tasks as compared to humans. AI is like an umbrella with different technologies, and uses the best tool for your social media branding.
Coronavirus or pandemic is a stressful situation for the world at the moment. Every one of us is trying to know the answers, by when would we get relief from this pandemic situation. However, we haven’t been able to get the right answer as yet. The pandemic has been quite worrisome, but soon we all will get out of this. Although, we may need the power of new technology in order to strategics to overcome the pandemic situation.
Also, we will need experienced resources and highly talented professionals to adopt the new technologies and make the most of it. However, as a large volume of data is being generated, therefore, the utilization of big data will play a major role in mitigating the risks. We will talk about it in detail, in this article.
We can’t ignore the role of big data
Big data analytics is playing a vital role in helping the experts to try and understand and overcome the pandemic situation. The experts are using a tool for statistical insights. So, the experts are able to prioritize the steps.
Information is a pivotal weapon that could be used to win any battle. Therefore, even in this situation, the use of good information would turn out to be quite helpful. And, the utilization of the information is based on the collection and management of it.
Jobs in ML
Basically, if the right amount of information is collected and stored in the right place, then only it could be sued to derive meaningful insights. Big data would help the experts to understand a lot about the disease, and so much of detailing would help to make better plans to improve the condition.
Understanding the current situation
Big data is used to understand the existing situation of the pandemic. It is spreading where the most, what could be the possible reasons etc. This is undoubtedly the most important information that the experts and the agencies would need to overcome the crisis. Only when the experts know what’s happening where then only they can plan what is to be done to save other places or to reduce the impact of the disease in some places.
For example, only after learning the situation or the conditions of the other countries, many countries would be able to plan for their own country. Therefore, the right kind of information, in terms of the spreading of the illness is required to make intelligent plans.
Whether a country is fighting a war, a pandemic situation, or trying to stop the forest fire, they would eventually need to first understand the situation and the current and the possible impact of the situation on the country and the people. This gives them the right inputs to prepare for the crisis. Also, the experts are able to figure out how many wand what kind of resources and equipment and tools they would need in order to overcome or fight the situation.
This could be understood very well as per the prevailing conditions. We know that the world needs more and more ventilators for the patients. Therefore, every area would need to first identify the number of ventilators they have and the probability of the ventilators they would need. Based on the insights, they can either buy or ask for a new set of ventilators. The same goes out for all the necessary medical equipment.
Therefore, data analytics solutions have a major role to play when it comes to making strong strategies to get rid of the crisis. It is just that we have to invest in the right technology to get insights.
Gaining more knowledge about the most affected
Tough, the people suffering from the disease are most affected, but the whole world is somewhat affected by this pandemic. Especially, the daily wagers and several industries are affected really badly. Therefore, the governments and the agencies have to plan to improve their conditions as well. But, in order to make plans, first of all, they will need to acquire the right kind of information. The experts will have to identify the areas affected the most, the probable number of people, the possible losses, etc.
Based on the data and the insights collected from the data, the governments and the agencies could plan to improve their condition. For example, right now, due to the lock-down, many daily wagers are affected adversely. Therefore, in order to make sure that they get food on time, they will have to first identify the number of people, the areas, etc.
Later on, based on the stats, the right plans could be made to help the daily wagers and the most affected businesses. Also, the agencies have to make plans to improve the health condition of everyone, including the most affected people.
As per one of the reports, it was believed that the flu pandemic might cost the world somewhere around $4 trillion, that’s definitely a huge number. Therefore, first of all, the government and the agencies will have to estimate the financial losses and the impact that it may have on the world. Then only the experts could plan to overcome the financial problems.
The pandemic situation has severely affected the world in many ways. Though the financial losses could be recovered in some time, the loss of lives might not be recovered. Therefore, it is important to make sure that we take all the necessary steps to stay away from the disease. We have to do everything possible to ensure that we are saved.
As we know that it spreads like anything. Although technology might be used to improve the condition, we would need many more modern tools and techniques to rectify all the problems.
In this story I wanna show you another project that I just done: classifying images from CIFAR-10 dataset usingCNN. Such classification problem is obviously a subset of computer vision task. So, for those who are interested to this field probably this article might help you to start with.
CIFAR-10 is an image dataset which can be downloaded from here. It contains 60000 tiny color images with the size of 32 by 32 pixels. The dataset consists of 10 different classes (i.e. airplane, automobile, bird, cat, deer, dog, frog, horse, ship and truck), in which each of those classes consists of 6000 images. On the other hand, CNN is used in this project due to its robustness when it comes to image classification task. That’s for the intro, now let’s get our hands dirty with the code!
Note: I put the full code at the very end of this article.
Loading modules and dataset
The very first thing to do when we are about to write a code is importing all required modules. We will discuss each of these imported modules as we go.
import cv2
import numpy as np
import matplotlib.pyplot as plt
import seaborn as sns; sns.set()
from keras.datasets import cifar10
from sklearn.preprocessing import OneHotEncoder
from sklearn.metrics import confusion_matrix
from keras.layers import Conv2D, MaxPool2D, Flatten, Dense, Dropout
from keras.models import Sequential, load_model
from keras.callbacks import EarlyStopping
The CIFAR-10 dataset itself can either be downloaded manually from this link or directly through the code (using API). To make things simpler, I decided to take it using Keras API. Here is how to do it:
If this is your first time using Keras to download the dataset, then the code above may take a while to run. FYI, the dataset size itself is around 160 MB. After the code finishes running, the dataset is going to be stored automatically to X_train, y_train, X_test and y_test variables, where the training and testing data itself consist of 50000 and 10000 samples respectively.
Now if we try to print out the shape of training data (X_train.shape), we will get the following output.
(50000, 32, 32, 3)
Here is how to read the shape: (number of samples, height, width, color channels). Keep in mind that in this case we got 3 color channels which represents RGB values. If you have ever worked with MNIST handwritten digit dataset, you will see that it only has single color channel since all images in the dataset are shown in grayscale.
Jobs in ML
On the other hand, if we try to print out the value of y_train, it will output labels which are all already encoded into numbers:
Since it’s kinda difficult to interpret those encoded labels, so I would like to create a list of actual label names. This list sequence is based on the CIFAR-10 dataset webpage.
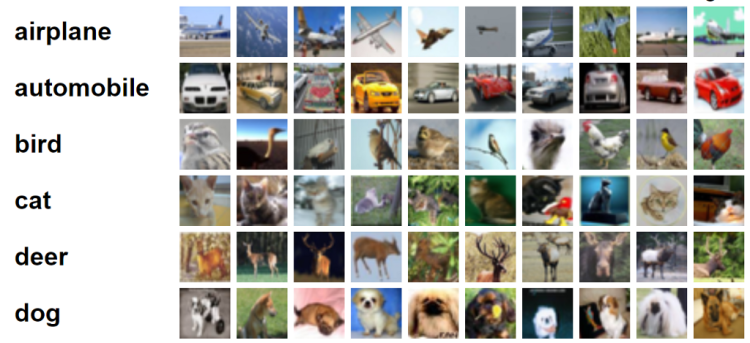
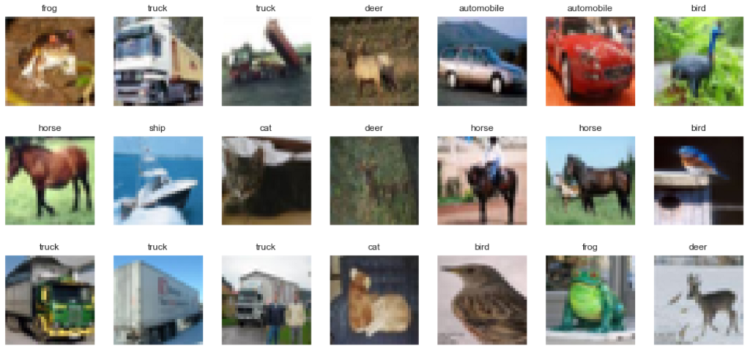
Before doing anything with the images stored in both X variables, I wanna show you several images in the dataset along with its labels. Here’s how I did it:
index = 0
for i in range(3):
    for j in range(7):
        axes[i,j].set_title(labels[y_train[index][0]])
        axes[i,j].imshow(X_train[index])
        axes[i,j].get_xaxis().set_visible(False)
        axes[i,j].get_yaxis().set_visible(False)
        index += 1
plt.show()
The code above tells the computer that we are about to display the first 21 images in the dataset which are divided into 7 columns and 3 rows. The figsize argument is used just to define the size of our figure. We can see here that I am going to set the title using set_title() and display the images using imshow(). Below is how the output of the code above looks like.
The first 21 images in CIFAR-10 dataset.
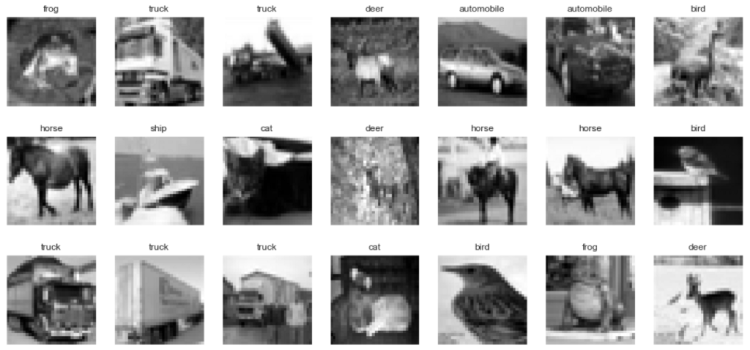
It’s good to know that higher array dimension in training data may require more time to train the model. So as an approach to reduce the dimensionality of the data I would like to convert all those images (both train and test data) into grayscale. Luckily it can simply be achieved using cv2 module.
X_train = np.array([cv2.cvtColor(image, cv2.COLOR_BGR2GRAY) for image in X_train])
X_test = np.array([cv2.cvtColor(image, cv2.COLOR_BGR2GRAY) for image in X_test])
Now we can display the pictures again just to check whether we already converted it correctly. Notice that the code below is almost exactly the same as the previous one. Here I only add ‘gray’ as the cmap (colormap) argument to make those images look better.
index = 0
for i in range(3):
    for j in range(7):
        axes[i,j].set_title(labels[y_train[index][0]])
        axes[i,j].imshow(X_train[index], cmap='gray')
        axes[i,j].get_xaxis().set_visible(False)
        axes[i,j].get_yaxis().set_visible(False)
        index += 1
plt.show()
The output should be looking like this:
The first 21 images in CIFAR-10 dataset converted to grayscale.
Afterwards, we also need to normalize array values. We know that by default the brightness of each pixel in any image are represented using a value which ranges between 0 and 255. In order for neural network to work best, we need to convert this value such that it’s going to be in the range between 0 and 1. And it’s actually pretty simple to do so:
X_train  = X_train/255
X_test  = X_test/255
And well, that’s all what we need to do to preprocess the images.
Label preprocessing
Remember our labels y_train and y_test? Those are still in form of a single number ranging from 0 to 9 stored in array. In fact, such labels are not the one that a neural network expect. Instead, all those labels should be in form of one-hot representation. To do that, we can simply use OneHotEncoder object coming from Sklearn module, which I store in one_hot_encoder variable.
one_hot_encoder = OneHotEncoder(sparse=False)
Now we will use this one_hot_encoder to generate one-hot label representation based on data in y_train.
one_hot_encoder.fit(y_train)
The code above hasn’t actually transformed y_train into one-hot. It just uses y_train as the transformation basis — well, I hope my explanation is understandable. Therefore we still need to actually convert both y_train and y_test. Here is how to do it:
Now if we did it correctly, the output of printing y_train or y_test will look something like this, where label 0 is denoted as [1, 0, 0, 0, …], label 1 as [0, 1, 0, 0, …], label 2 as [0, 0, 1, 0, …] and so on.
Before going any further, lemme review our 4 important variables first: those are X_train, X_test, y_train and y_test. Up to this step, our X data holds all grayscaled images, while y data holds the ground truth (a.k.a labels) in which it’s already converted into one-hot representation.
Notice here that if we check the shape of X_train and X_test, the size will be (50000, 32, 32) and (10000, 32, 32) respectively. Well, actually this shape is not acceptable by Conv2D layer that we are going to implement. So, we need to reshape those two arrays using the following code:
Now our X_train and X_test shapes are going to be (50000, 32, 32, 1) and (10000, 32, 32, 1), where the number 1 in the last position indicates that we are now using only 1 color channel (gray). Next, we are going to use this shape as our neural net’s input shape. To make it looks straightforward, I store this to input_shape variable.
Subsequently, we can now construct the CNN architecture. In this project I decided to be using Sequential() model. Below is how I create the neural network.
There are several things I wanna highlight in the code above. First, filters used in all convolution layers are having the size of 3 by 3 and stride 1, where the number filters are increasing twice as many as its previous convolution layer before eventually reaches max-pooling layer. This convolution-pooling layer pair is repeated twice as an approach to extract more features in image data. Secondly, all layers in the neural network above (except the very last one) are using ReLU activation function because it allows the model to gain more accuracy faster than sigmoid activation function. Next, the dropout layer with 0.5 rate is also used to prevent the model from overfitting too fast. Lastly, notice that the output layer of this network consists of 10 neurons with softmax activation function. The reason is because in this classification task we got 10 different classes in which each of those is represented by each neuron in that layer. The use of softmax activation function itself is to obtain probability score of each predicted class.
I am not quite sure though whether my explanation about CNN is understandable, thus I suggest you to read this article if you want to learn more about the neural net architecture.
Now if we run model.summary(), we will have an output which looks something like this. It’s also important to know that None values in output shape column indicates that we are able to feed the neural network with any number of samples.
The next step we do is compiling the model. In this case we are going to use categorical cross entropy loss function because we are dealing with multiclass classification. By the way if we perform binary classification task such as cat-dog detection, we should use binary cross entropy loss function instead. To the optimizer, I decided to use Adam as it usually performs better than any other optimizer. Lastly, I use acc (accuracy) to keep track of my model performance as the training process goes.
Before actually training the model, I wanna declare an early stopping object. This is going to be useful to prevent our model from overfitting. What’s actually said by the code below is that I wanna stop the training process once the loss value approximately reaches at its minimum point. This is defined by monitor and mode argument respectively.
es = EarlyStopping(monitor='val_loss', mode='min', verbose=1, patience=3)
That’s all of the preparation, now we can start to train the model. I keep the training progress in history variable which I will use it later. Notice that our previous EarlyStopping() object is put in the callbacks argument of fit() function.
history = model.fit(X_train, y_train, epochs=20, batch_size=32, validation_data=(X_test, y_test), callbacks=[es])
Here’s how the training process goes. I delete some of the epochs to make things look simpler in this page.
Notice the training process above. We see there that it stops at epoch 11, even though I define 20 epochs to run in the first place. This is what’s actually done by our early stopping object. If we pay more attention to the last epoch, indeed the gap between train and test accuracy has been pretty high (79% vs 72%), thus training with more than 11 epochs will just make the model becomes more overfit towards train data.
By the way if we wanna save this model for future use, we can just run the following code:
model.save('CNN_CIFAR.h5')
Next time we want to use the model, we can simply use load_model() function coming from Keras module like this:
model = load_model('CNN_CIFAR.h5')
Model evaluation
After the training completes we can display our training progress more clearly using Matplotlib module. Let’s show the accuracy first:
Loss value decrease (orange represents loss towards test data).
According to the two figures above, we can conclude that our model is slightly overfitting due to the fact that our loss value towards test data did not get any lower than 0.8 after 11 epochs while the loss towards train data keeps decreasing. At the same moment, we can also see the final accuracy towards test data remains at around 72% even though its accuracy on train data almost reaches 80%. In fact, the accuracy of perfect model should be having high accuracy score on both train and test data. Hence, there’s still a room for improvement.
Now we are going to display a confusion matrix in order to find out the misclassification distribution of our test data. To do so, we need to perform prediction to the X_test like this:
predictions = model.predict(X_test)
Remember that these predictions are still in form of probability distribution of each class, hence we need to transform the values to its predicted label in form of a single number encoding instead. This can be achieved using np.argmax() function or directly using inverse_transform method. For this case, I prefer to use the second one:
Now if I try to print out the value of predictions, the output will look something like the following. Keep in mind that those numbers represent predicted labels for each sample.
array([[3.],
       [8.],
       [8.],
       ...,
       [5.],
       [1.],
       [7.]])
Also, remember that our y_test variable already encoded to one-hot representation at the earlier part of this project. So, we need to inverse-transform its value as well to make it comparable with the predicted data.
Now, up to this stage, our predictions and y_test are already in the exact same form. Thus, we can start to create its confusion matrix using confusion_matrix() function from Sklearn module. We will store the result in cm variable.
cm = confusion_matrix(y_test, predictions)
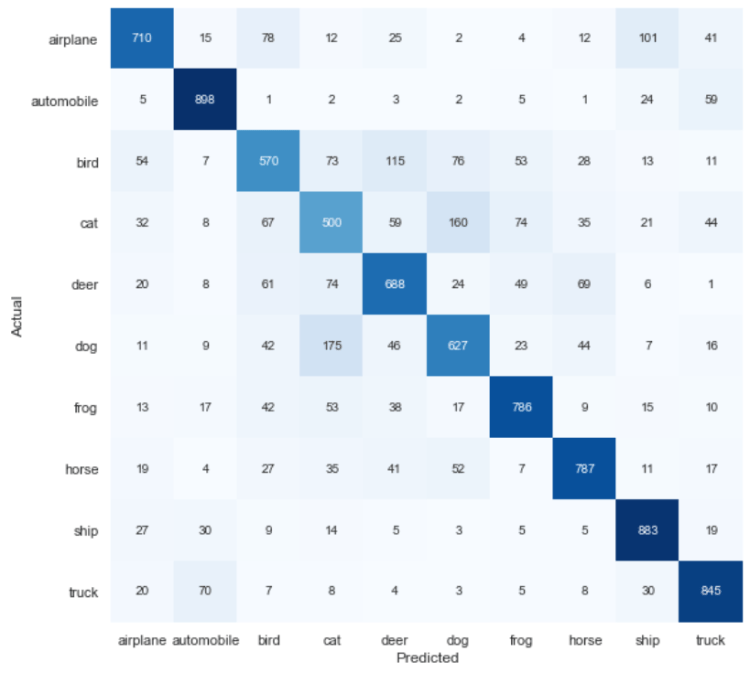
Now to make things look clearer, we will plot the confusion matrix using heatmap() function.
And here is how the confusion matrix generated towards test data looks like. We can see here that even though our overall model accuracy score is not very high (about 72%), but it seems like most of our test samples are predicted correctly. Here’s how to read the numbers below in case you still got no idea: 155 bird image samples are predicted as deer, 101 airplane images are predicted as ship, and so on.
Confusion matrix towards test data.
Lastly, I also wanna show several first images in our X_test. To do that, we need to reshape the image from (10000, 32, 32, 1) to (10000, 32, 32) like this:
Well, the code above is done just to make Matplotlib imshow() function to work properly to display the image data. Since we will also display both actual and predicted label, it’s necessary to convert the values of y_test and predictions to integer (previously inverse_transform() method returns float).
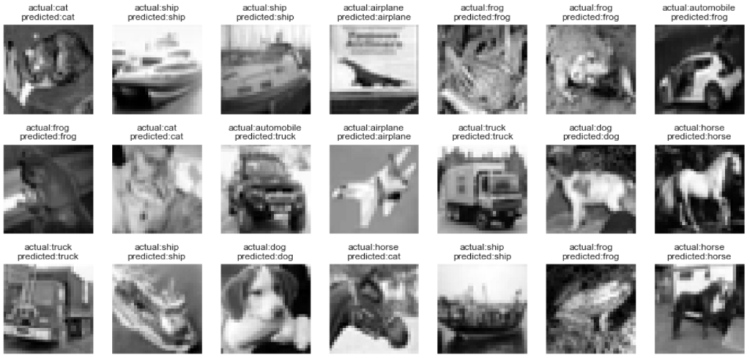
Finally we can display what we want. Notice that in the figure below most of the predictions are correct. Only some of those are classified incorrectly.
index = 0
for i in range(3):
    for j in range(7):
        axes[i,j].set_title('actual:' + labels[y_test[index][0]] + '\n'
                            + 'predicted:' + labels[predictions[index][0]])
        axes[i,j].imshow(X_test[index], cmap='gray')
        axes[i,j].get_xaxis().set_visible(False)
        axes[i,j].get_yaxis().set_visible(False)
        index += 1
plt.show()
Several predictions on test data.
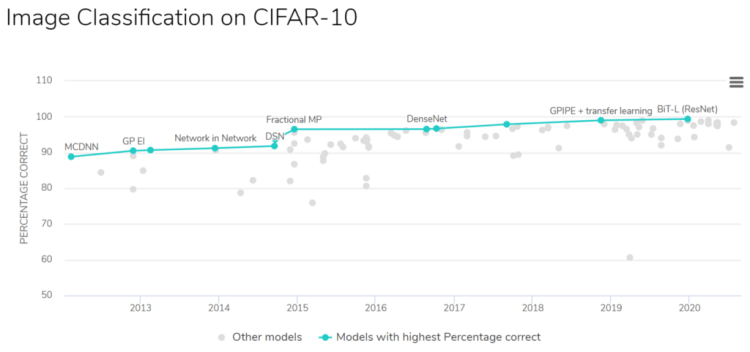
By the way, I found a page on the internet which shows CIFAR-10 image classification researches along with its accuracy ranks. The papers are available in this page, and luckily those are free to download. Just click on that link if you’re curious how researchers of those papers obtain their model accuracy.
That’s all of this image classification project. Please lemme know if you can obtain higher accuracy on test data! See you in the next article 🙂
Note: here’s the code for this project. If you find that the accuracy score remains at 10% after several epochs, try to re run the code. It’s probably because the initial random weights are just not good.
NLP and deep learning continue to advance, nearly on a daily basis. Check out these recent must-read guides, feature articles, and other resources to keep you on top of the latest advancements and ahead of the curve.


