365 Data Science is an online educational career website that offers the incredible opportunity to find your way into the data science world no matter your previous knowledge and experience.
Data bias in machine learning is a type of error in which certain elements of a dataset are more heavily weighted and/or represented than others. A biased dataset does not accurately represent a model’s use case, resulting in skewed outcomes, low accuracy levels, and analytical errors.
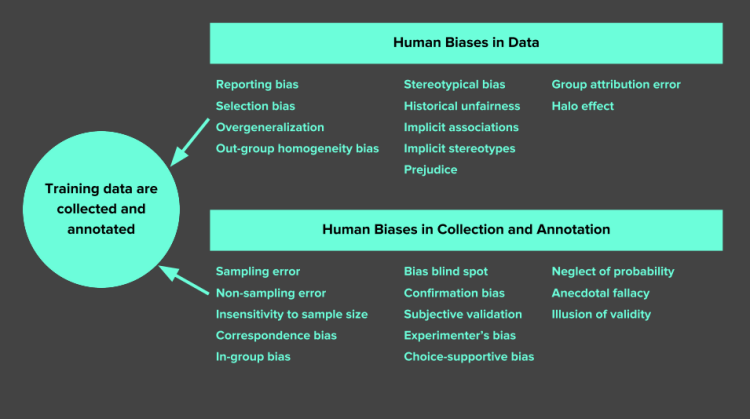
In general, training data for machine learning projects has to be representative of the real world. This is important because this data is how the machine learns to do its job. Data bias can occur in a range of areas, from human reporting and selection bias to algorithmic and interpretation bias. The image below is a good example of the sorts of biases that can appear in just the data collection and annotation phase alone.
Resolving data bias in machine learning projects means first determining where it is. It’s only after you know where a bias exists that you can take the necessary steps to remedy it, whether it be addressing lacking data or improving your annotation processes. With this in mind, it’s extremely important to be vigilant about the scope, quality, and handling of your data to avoid bias where possible. This effects not just the accuracy of your model, but can also stretch to issues of ethics, fairness, and inclusion.
Below, we’ve listed seven of the most common types of data bias in machine learning to help you analyze and understand where it happens, and what you can do about it.
Jobs in AI
Types of data bias:
Though not exhaustive, this list contains common examples of data bias in the field, along with examples of where it occurs.
Sample bias: Sample bias occurs when a dataset does not reflect the realities of the environment in which a model will run. An example of this is certain facial recognition systems trained primarily on images of white men. These models have considerably lower levels of accuracy with women and people of different ethnicities. Another name for this bias is selection bias.
Exclusion bias: Exclusion bias is most common at the data preprocessing stage. Most often it’s a case of deleting valuable data thought to be unimportant. However, it can also occur due to the systematic exclusion of certain information. For example, imagine you have a dataset of customer sales in America and Canada. 98% of the customers are from America, so you choose to delete the location data thinking it is irrelevant. However, this means you model will not pick up on the fact that your Canadian customers spend two times more.
Measurement bias: This type of bias occurs when the data collected for training differs from that collected in the real world, or when faulty measurements result in data distortion. A good example of this bias occurs in image recognition datasets, where the training data is collected with one type of camera, but the production data is collected with a different camera. Measurement bias can also occur due to inconsistent annotation during the data labeling stage of a project.
Recall bias: This is a kind of measurement bias, and is common at the data labeling stage of a project. Recall bias arises when you label similar types of data inconsistently. This results in lower accuracy. For example, let’s say you have a team labeling images of phones as damaged, partially-damaged, or undamaged. If someone labels one image as damaged, but a similar image as partially damaged, your data will be inconsistent.
Observer bias: Also known as confirmation bias, observer bias is the effect of seeing what you expect to see or want to see in data. This can happen when researchers go into a project with subjective thoughts about their study, either conscious or unconscious. We can also see this when labelers let their subjective thoughts control their labeling habits, resulting in inaccurate data.
Racial bias: Though not data bias in the traditional sense, this still warrants mentioning due to its prevalence in AI technology of late. Racial bias occurs when data skews in favor of particular demographics. This can be seen in facial recognition and automatic speech recognition technology which fails to recognize people of color as accurately as it does caucasians. Google’s Inclusive Images competition included good examples of how this can occur.
Association bias: This bias occurs when the data for a machine learning model reinforces and/or multiplies a cultural bias. Your dataset may have a collection of jobs in which all men are doctors and all women are nurses. This does not mean that women cannot be doctors, and men cannot be nurses. However, as far as your machine learning model is concerned female doctors and male nurses do not exist. Association bias is best known for creating gender bias, as was visible in the Excavating AI study.
How do I avoid data bias in machine learning projects?
The prevention of data bias in machine learning projects is an ongoing process. Though it is sometimes difficult to know when your data or model is biased, there are a number of steps you can take to help prevent bias or catch it early. Though far from a comprehensive list, the bullet points below provide an entry-level guide for thinking about data bias for machine learning projects.
To the best of your ability, research your users in advance. Be aware of your general use-cases and potential outliers.
Ensure your team of data scientists and data labelers is diverse.
Where possible, combine inputs from multiple sources to ensure data diversity.
Create a gold standard for your data labeling. A gold standard is a set of data that reflects the ideal labeled data for your task. It enables you to measure your team’s annotations for accuracy.
Make clear guidelines for data labeling expectations so data labelers are consistent.
Use multi-pass annotation for any project where data accuracy may be prone to bias. Examples of this include sentiment analysis, content moderation, and intent recognition.
Enlist the help of someone with domain expertise to review your collected and/or annotated data. Someone from outside of your team may see biases that your team has overlooked.
Analyze your data regularly. Keep track of errors and problem areas so you can respond to and resolve them quickly. Carefully analyze data points before making the decision to delete or keep them.
Make bias testing a part of your development cycle. Google, IBM, and Microsoft have all released tools and guides to help with analyzing bias for a number of different data types.
If you’re looking for a deeper dive into how bias occurs, its effects on machine learning models, and past examples of it in automated technology, we recommend checking out Margaret Mitchell’s “Bias in the Vision and Language of Artificial Intelligence” presentation. You can take a look at the slides for the presentation here, or watch the video below.
In closing
It’s important to be aware of the potential biases in machine learning for any data project. By putting the right systems in place early and keeping on top of data collection, labeling, and implementation, you can notice it before it becomes a problem, or respond to it when it pops up.
Alternatively, if you are looking at putting together a team of diverse data scientists and data labelers to ensure high quality data, get in touch. With access to leading data scientists in a variety of fields and a global community of 1,000,000+ contributors, Lionbridge can help you define, collect, and prepare the data you need for your machine learning project.
It is an era where ‘data is the new oil’, artificial intelligence (AI) has proven to be an indispensable part of the fight against COVID — the global pandemic. AI is being used from research to healthcare to agriculture, while it is also an effective tool that supports efficient remote communication, enables telemedicine, and protect food security. The world has been taken by surprise with the sudden appearance and rapid spread of COVID-19 which is why speed has become of vital essence.
source: coe.int
Although genetic code sequencing of the new coronavirus and producing diagnostic tests for it was done in record time, scientists are still racing against time to develop the drugs and vaccines against the virus. AI is thus helping in accelerating the process of drug discovery, by making quality data extracted from our DNA, lifestyle, and environmental factors easily-accessible.
AI fighting COVID-19, the highlights:-
AI enhances our capacity to reason based on the available biomedical data and information in a systematic search. This is helpful in proper screening, tracking, and predicting current and future patients.
AI is accurate in predicting mortality risk by evaluating the patient’s previous data. Beside it is helpful in population screening, prepare medical help, and sending notifications in real-time and offering suggestions to control infection.
With early detection and diagnosis of the infection drugs and vaccine development has become faster.
In an ever-changing environment, the capability of the machine to handle the ginormous amount of data is more accurate and can be precisely harnessed for tireless and unbiased super-researches.
In high-pressure times, AI is trying to reduce the workload of healthcare workers significantly.
And though AI is fairly young, it seems to have outshone its worth to fight the largest global pandemic since the Spanish flu.
Jobs in AI
The Main Applications Of AI Fighting The COVID-19 Pandemic
Early detection and diagnosis of the infection
With quick analysis and red flagging of COVID symptoms, the authorities are alerted about the patients in no time. This accelerates decision making, developing a new diagnosis and management system, thus bringing down the cost of efforts around COVID detection and treatment. Combined with medical imaging technologies like Computed tomography (CT), Magnetic resonance imaging (MRI) scan the AI is making diagnostic of COVID faster and accurate.
Accurate and constant treatment monitoring
AI’s smart network has the ability to automatically monitor and predict the spread of the virus. Exact visual features of this disease can be framed through the neural networks for better monitoring and treatment of COVID 19. The regular updates about affected individuals also keep coming on a day-to-day basis, helping in providing follow-up treatment and diagnosis.
Contact tracing of the individuals
AI has the ability to process huge amounts of data in the shortest period of time which is why it has become a valuable tool to analyze the infection levels, virus detection, and identifying the hot spot clusters. It can thus be successfully used for tracing individuals and the areas they have contacted to help predict the disease and its reappearance.
As the cases of COVID are surging, monitoring a large set of the population for taking proper measures to stay safeguard is difficult. But with smart technology like AI, a simple task as identifying people who aren’t wearing masks or violating the correct method of wearing it is now being done by AI’s deep learning technique with specific software being installed into the CCTV cameras to identify perpetrators among the crowd. Once identified, a quick notification is sent to the police headquarters with the consequent updates being sent to the patrol police to nab the wrongdoers.
Projection of cases and mortality
Normally making predictions and tracking the spread of infection is not possible by analyzing the data spread across verticals like — collected information, social media, and other media platforms. However, the deep learning technique of AI is helping in stepping over the vulnerabilities and the outcome of COVID across regions, people, and countries.
COVID 19 and X-rays
Chest X-rays are now being set as a standardized procedure to diagnose COVID-19 as Polymerase Chain Reaction (PCR) is not only time consuming but quite expensive. Conversely, a simple chest X-ray cannot help in distinguishing the extent of the disease infecting the lungs. Artificial Intelligence, in collaboration with Chest X-rays, helps in identifying the abnormal findings such as ground-glass opacities in the lungs, characteristic of COVID-19 disease thus becoming a blessing for patients in the Intensive Care Unit (ICU).
Disease prevention
The nature and pattern of COVID make it difficult to anticipate what lies in the future. However, with the assistance of AI technology predictive and preventive healthcare has become a reality. We can now make predictions about the probable infection sites, the virus influx, number of beds, and healthcare professionals required along with the future virus and disease prevention by identifying the traits, causes, and reasons for the spread of infection. Being an inexhaustible tool, AI is by-and-by becoming a more mature and robust technology for the future fight against epidemics and pandemics.
Leveling Up the Fight…
AI has been addressing the limitation of human knowledge. It is known to process large amounts of data — called Big Data — and detect patterns in the data. As the driving force behind the curtains using techniques of machine learning or deep learning, artificial intelligence enables us to predict future outcomes as well as reveal other insights about the data.
COVID-19 has truly increased the workload of healthcare workers across each level. But AI can reduce that pressure significantly with early diagnosis, digital approaches, and decision science. AI along with the adoption of healthcare cloud technology and digital recordkeeping gives a stronghold to build and control access to digital health records anywhere, even while traveling or remotely from home. It just requires a necessary addition — a secure Virtual Private Networks (VPNs) like NordVPN, to the organization’s intranet to decrease unauthorized access and chances of data breaches. NordVPN review will show the benefits and features of this Next-generation encrypted VPN service.
In essence, AI is one of the quickest and easiest ways to track the spread of this virus, identify high-risk patients, and bring real-time virus control. Even though at present it hasn’t reached its perfect self, the future looks bright for AI technology.
We’ve been working quietly on this project for some time, but finally, we’re ready to reveal our latest collaboration with a top industry expert in the field of data science.
We’re super excited to announce the launch of Starting a Career in Data Science with Ken Jee.
Ken Jee is one of the most popular YouTubers providing insights into data science, with over 70k followers on his channel. Currently Head of Data Science at Scouts Consulting Group, he has worked for several prominent industries: consulting, start-ups, and conglomerates like GE. Ken has an MSc in Computer Science (DePaul University), and a BS in Economics (Towson University).
In this course, he leverages his rich experience in recruitment of data scientists to share his unique perspective on landing a job in the field.
You will learn everything you need to start a successful career in data science: how to create your data science project portfolio, build your resume, get an interview through networking, and succeed through all stages of the data science interview process.
Ken has also included exclusive mock-interviews and 1-on-1 conversations with professionals who have already landed data science positions. Those not only give you an inside look into the mind of successful candidates, but also show you how the interview process really works.
In addition, this course provides you with resume templates, downloadable materials, some useful infographics, as well as a section on how to optimize your LinkedIn, Github, and Kaggle profiles for recruitment purposes.
Starting a Career in Data Science is part of the 365 Data Science Online Program, so existing subscribers can access the courses at no additional charge. To learn more about the course curriculum or subscribe to the Data Science Online Program, please visit our Courses page.
Data science is an attractive field because not only is it lucrative, but you can have opportunities to work on interesting projects, and you’re always learning new things. If you’re trying to get started from the ground up, then review this guide to prepare for the interview essentials.
This article presents 10 use-cases for synthetic data, showing how enterprises today can use this artificially generated information to train machine learning models or share data externally without violating individuals’ privacy.
The HOSTKEY GPU Grant Program is open to specialists and professionals in the Data Science sector performing research or other projects centered on innovative uses of GPU processing and which will glean practical results in the field of Data Science, with the objective of supporting basic scientific research and prospective startups.
GPT-3 is the largest natural language processing (NLP) transformer released to date, eclipsing the previous record, Microsoft Research’s Turing-NLG at 17B parameters, by about 10 times. This has resulted in an explosion of demos: some good, some bad, all interesting.
Microsoft Azure Machine Learning x Udacity — Lesson 3 Notes
Detailed Notes for Machine Learning Foundation Course by Microsoft Azure & Udacity, 2020 on Lesson 3 — Model Training
This lesson is about how to prepare data and transform it into trainedmachine learningmodels. This lesson will also introduce you to ensemble learning and automated machine learning.
Data Import & Transformation
Data Wrangling:
Cleaning, restructuring, enriching data to transform it into a suitable format for training machine learning models. This is an iterative process.
Steps:
Discovery & Exploration of data
Transformation of raw data
Publish data
Managing Data:
Datastores:
A layer of abstraction. It stores all the information needed to connect to a particular storage device
Datasets:
Resources for exploring, transforming, managing data. A reference to a point in storage.
Big Data Jobs
Data Access Workflow:
Create a datastore
Create a dataset
Create a dataset monitor (critical to detecting issues in data, e.g. Data Drift)
Introducing Features
Feature Selection
Dimensionality Reduction
Feature Engineering
Core techniques
Various places to apply feature engineering: 1) datastores 2) a python library 3) during model training
Part-of: extract a part of a certain data structure, e.g. a part of date like hour
Binning: group entities into bins and apply aggregations on them
Flagging: deriving Boolean conditions
Frequency-based: calculate the various frequencies of occurrence of data
Embedding or Feature Learning: a relatively low-dimensional space into which you can translate high-dimensional vectors
Deriving by Example: aim to learn values of new features using examples of existing features
Feature Selection
Given an initial dataset, create a number of new features. Find out useful and filter out features.
Reasons for Feature Selection:
1. Eliminate redundant, irrelevant, or highly correlated feature
2. Dimensionality reduction
Dimensionality Reduction Algorithms:
Principle Component Analysis (PCA): Linear technique with more of a statistical approach.
t-Distributed Stochastic Neighboring Entities (t-SNE): A probabilities approach to reduce dimensionality. The target number of dimensions with t-SNE is usually 2–3 dimensions. It is used a lot for visualizing data.
Feature Embedding: Train a separate machine learning model to encode a large number of features into a smaller number of features also super-features.
All the above are also considered to be Feature Learning techniques.
Filter-Based Feature Selection: Helps identify the columns in input dataset that have a dataset that has the greatest predictive power
Permutation Feature Importance: Helps determine the best features to use in a model by computing a set of feature-important-scores for your dataset
Data Drift
Data Drift is a change in the input data for a model. Over time, data drift causes degradation in the model’s performance, as the input data drifts farther and farther from the data on which the model was trained.
It is the top reason why accuracy drops over time. Detecting data drift helps identify model performance issues and also enables us to trigger retraining processing to avoid that.
Causes of Data Drift:
Upstream process changes e.g. A sensor is replaced, causing the units of measurement to change (e.g., from minutes to seconds)
Data quality issues e.g. sensor breaks
Natural data drift: data is not static e.g. customer behavior
Covariate shift: changes in the relationship between features
Dataset Monitors:
Dataset Monitors can be set up to provide alerts to assist in detecting data drifts over a dataset. They will help not only create models that are good at a given point in time but also models that keep their level of performance in time.
Monitoring for Data Drift:
Monitoring/detecting early enough cases of data drift are critical to maintaining a healthy state of the model. Data drift algorithm provides an overall measure of the change that occurs within data.
The process of monitoring for data drift involves:
Specifying a baseline dataset — usually the training dataset. used originally for training
Specifying a target dataset — usually the input data for the model
Comparing these two datasets over time, to monitor for differences
Scenarios for setting up data drift monitors in Azure ML:
Monitoring a models input data for drift from the model’s training
Monitoring a time-series dataset for drift from a previous time period.
Performing analysis of past data. Typically done on historical data to better understand the dynamics of the data, better decision-making to improve model
Understanding Data Drift Results:
Results are produced in charts — Drift Overview shows the following set of charts:
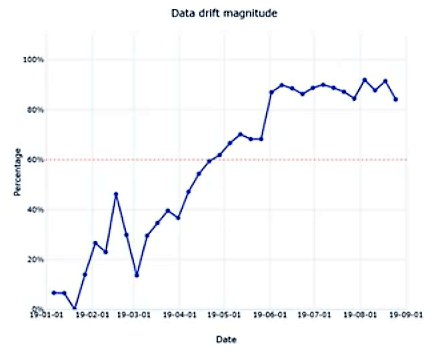
Data Drift Magnitude: percentage between the baseline and target dataset over time and ranges between 0–100% (where 0 indicates identical datasets and 100 indicates completely separable datasets).
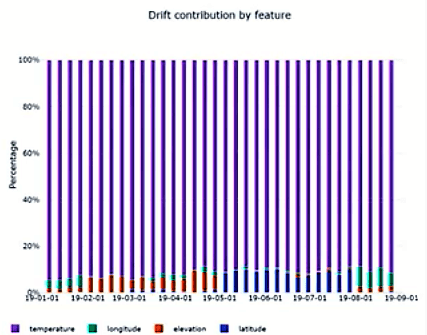
Drift Contribution by Feature: helps understand which particular features of your dataset have contributed most to the data drift process. Identifying which those features are is very important because then they can be better understood, i.e.1) the way they evolve through time, and 2) how to use them in the most appropriate way in model training.
Here are a couple of different types of comparisons you might want to make when monitoring for data drift:
Comparing input data vs. training data. This is a proxy for model accuracy; that is, an increased difference between the input vs. training data is likely to result in a decrease in model accuracy.
Comparing different samples of time series data. In this case, you are checking for a difference between one time period and another. For example, a model trained on data collected during one season may perform differently when given data from another time of year. Detecting this seasonal drift in the data will alert you to potential issues with your model’s accuracy.
Model Training Basics
The goal of the Model Training process is to produce a trained model that you can later use to predict. We want to be able to give the model a set of input features, X, and have it predict the value of some output feature, y.
It is important to establish the problem to be solved e.g a classification or regression problem. The framing of the problem will influence both the choice of algorithms in the training process as well as the various approaches to take to get to the desired result.
The important prerequisite is to understand, transform data, create new features, selecting features that are most relevant to the training process. Once we have both problem time and training features defined, next steps are:
Decide whether to scale or encode your data
Splitting data (i.e. Training, Validation, and Test dataset)
Parameters and Hyperparameters:
When we train a model, a large part of the process involves learning the values of the parameters of the model. For example, earlier we looked at the general form for linear regression:
y = B0 + B1*x1 + B2*x2 + B3*x3 … + Bn*xn
The coefficients in this equation, B_0 … B_nB0…Bn, determine the intercept and slope of the regression line. When training a linear regression model, we use the training data to figure out what the value of these parameters should be. Thus, we can say that a major goal of model training is to learn the values of the model parameters.
In contrast, some model parameters are not learned from the data. These are called hyperparameters and their values are set before training. Here are some examples of hyperparameters:
The number of clusters (such as in a k-means clustering algorithm)
The learning rate of the model
We must choose some values for these hyperparameters, but we do not necessarily know what the best values will be prior to training. Because of this, a common approach is to make the best guess, train the model, and then tune adjust or tune the hyperparameters based on the model’s performance.
Splitting the Data:
As mentioned in the video, we typically want to split our data into three parts:
Training data
Validation data
Test data
We use the training data to learn the values for the parameters. Then, we check the model’s performance on the validation data and tune the hyperparameters until the model performs well with the validation data. We can adjust this hyperparameter and then test the model on the validation data once again to see if its performance has improved.
Finally, once we believe we have our finished model (with both parameters and hyperparameters optimized), we will want to do a final check of its performance — and we need to do this on some fresh test data that we did not use during the training process.
Model Training in Azure Machine Learning
Azure Machine Learning Service provides a comprehensive environment to implement model training processes, giving you a centralized place to work with all the artifacts involved in the process. It is also called a Machine Learning Managed Service and provides a platform which 1) simplifies the implementation of various tasks and 2) offers all the necessary kinds of services that will help create the best possible machine learning models. It provides out of the box managed services that help implement every step of the data science process.
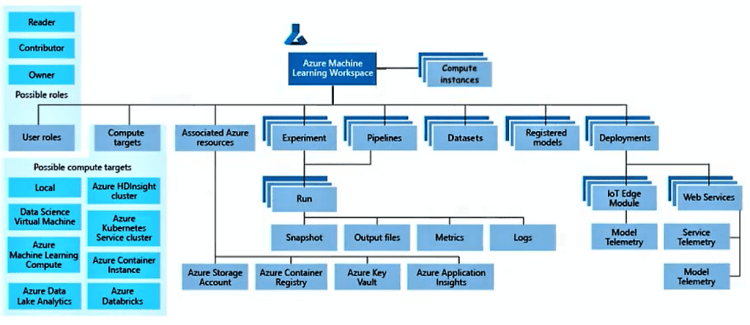
Taxonomy of Azure Machine Learning:
Several types of artifacts and several classes of concepts related to the implementation of the various steps of data science.
Workspace: The centralized place for working with all the components of the machine learning process. Everything in Azure Machine Learning revolves around this concept and is the very first thing to be created in the pipeline.
Compute Instances: A cloud-based workstation that gives you access to various development environments, such as Jupyter Notebooks.
Datasets: A key component in the data preparation and transformation processes that makes data available to Machine Learning processes.
Experiment: A container that helps you organize the model training process and group various artifacts/tasks related to Machine Learning processes run within Azure.
Run: A process that is executed in one of the compute resources e.g. model training, model validation, feature engineering. Every Run will output a set of artifacts: snapshots of data, output files, metrics, and logs.
Compute Targets: Machine Learning processes on a large variety of environments:
Local environments
Remote environments: Native Azure, Azure Data Dake AnalyticS
Registered Models: A service that provides snapshots and versioning for your trained models. After a model is created, it gets registered into the Model Registry.Note: Versioning is also important for Models, just like datasets, so that end-to-end traceability is achievable.
Deployment: Either in the form of web services or other types of environments, IoT Edge, etc.
Model Telemetry: Collect telemetry from live running models (model predictions using production input data).
Service Telemetry: Collect telemetry from live running services (model input data from web services)
Training Classifiers
In aclassificationproblem, the outputs are categorical or discrete.
Multi-Class Single-Label Classification: output is categorized between 3 or more. e.g. recognition of written numbers.
Multi-Class Multi-Label Classification: multiple categories and output can belong to more than one. e.g. text tagging
Examples of Classification Algorithms:
Logistic Regression
Support Vector Machine (SVM)
Training Regressors
In aregressionproblem, the output is numerical or continuous.
There are two main types of regression problems:
Regression to arbitrary values: prediction based on various inputs. No boundary defined for the output
Regression to vales between 0 and 1: bound the outputs between the interval of 0 and 1 and assigns it as a probability
Examples of Regression Algorithms:
Linear Regressor
Decision Forest Regressor
Evaluating Model Performance
The evaluation of a Machine Learning model is a critical step through which you calculate a set of performance metrics in order to assess its performance — such as the predictive power and accuracy of the model.
we need to split off a portion of our labeled data and reserve it for evaluating our model’s final performance. We refer to this as the test dataset.
The test dataset is a portion of labeled data that is split off and reserved for model evaluation.
When splitting the available data, it is important to preserve the statistical properties of that data. the data in the training, validation, and test datasets need to have similar statistical properties as the original data to prevent bias in the trained model. Splitting the data up randomly will help ensure that the two datasets are statistically similar.
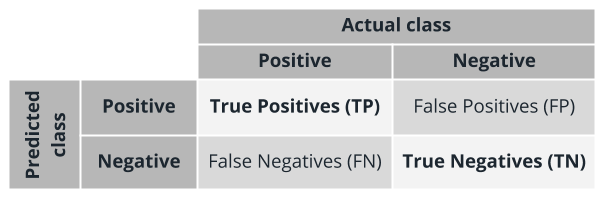
Confusion Matrices
A confusion matrix gets its name from the fact that it is easy to see whether the model is getting confused and misclassifying the data.
True positives are the positive cases that are correctly predicted as positive by the model
False positives are the negative cases that are incorrectly predicted as positive by the model
True negatives are the negative cases that are correctly predicted as negative by the model
False negatives are the positive cases that are incorrectly predicted as negative by the model
Evaluation Metrics for Classification
Accuracy: measures the goodness of a classification model as the proportion of true results to total cases
(TP+TN) / (TP+FP+FN+TN)
Precision: the proportion of true results overall positive results
TP / TP+FP
Recall: the fraction of all correct results returned by the model
TP / TP+FN
F1-Score: computed as the weighted average of precision and recall between 0 and 1, where the ideal F1-Score value is 1
2∗Precision+Recall / Precision∗Recall
Note: None of these independently are enough to provide an accurate measurement of metrics for classification and are used in pairs to get a complete image of a classification algorithm.
Model Evaluation Charts
When evaluating models, a level of understanding can be quickly gained using charts:
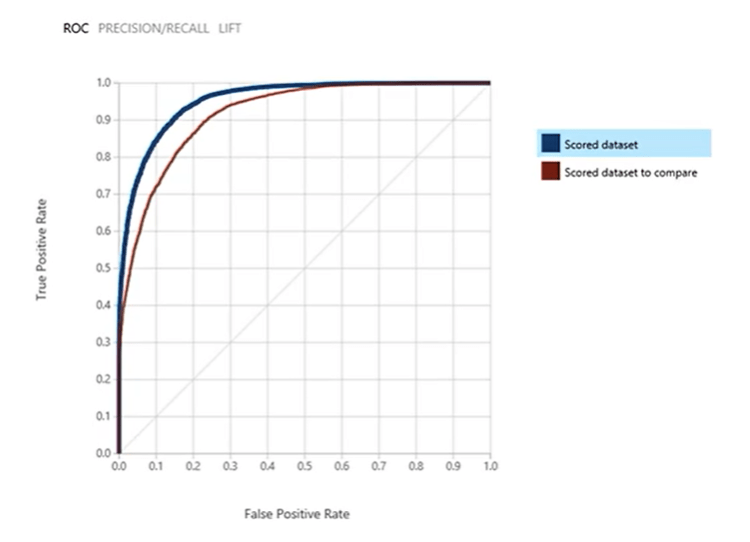
Receiver Operating Characteristics (ROC) Chart: a graph of the rate True Positives against the rate of False Positives. A metric that is derived from this is the Area Under the Curve (AUC).
AUC measures the area under the ROC curve plotted with true positives on the y-axis and false positives on the x-axis. This metric is useful because it provides a single number that lets you compare models of different types. An AUC of 0.5 indicates random guessing, while an AUC of 1.0 indicates perfect classification hence, the area under the curve should always fall between the range of 0.5 and 1.0.
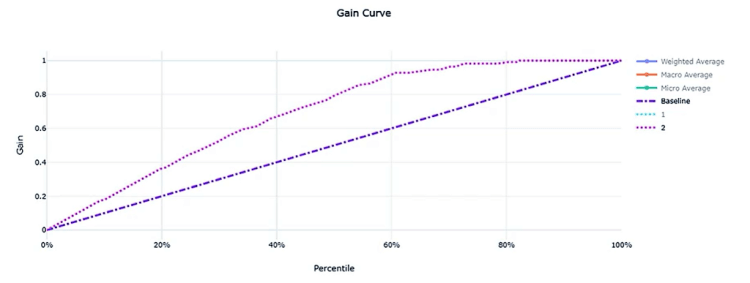
Gain and Lift Charts: deals with ordering with rank, ordering the prediction probabilities, and measure how much better the classifier can perform. The diagonal line corresponds to random guessing; the other line corresponds to performance when a trained classifier is used. Ideally, the latter line should be as far away from the former as possible.
Evaluation Metrics for Regression
Root Mean Squared Error (RMSE): the square root of the squared differences between the predicted and actual values. It creates a single value that summarizes the error in the model. By squaring the difference, the metric disregards the difference between over-prediction and under-prediction.
Mean Absolute Error (MAE): Average of the absolute difference between each prediction and the true value. It measures how close the predictions are to the actual outcomes; thus, a lower score is better.
R-Squared: known as the coefficient of determination. How close the regression line is to the true values.
Spearman Correlation: Strength and direction of the relationship between predicted and actual values.
Model Evaluation Charts
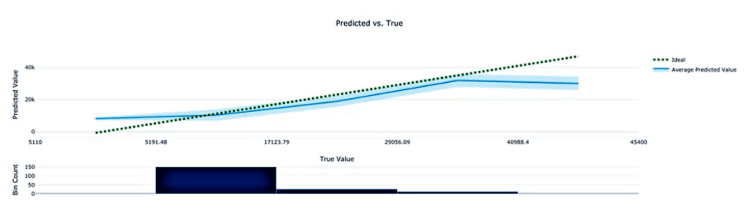
Predicted vs. True Chart: displays the info/relationship between the predicted and the true value. Shown below, the perfect regressor is represented by the diagonal line whereas the predicted line is the one below it indicating errors. At the bottom of the chart, the histogram shows how the true values are distributed in your prediction results.
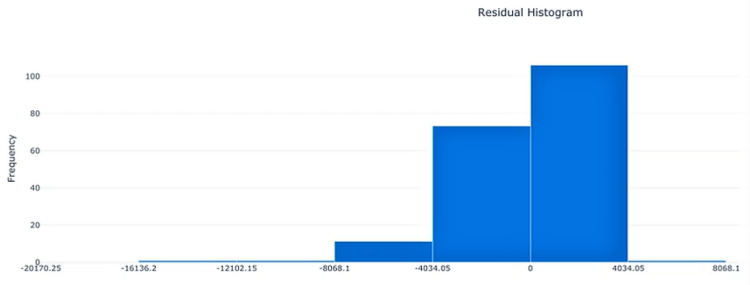
Histogram of Residuals: represents the distribution of the true value subtracted by the predicted value hence, the difference. When the model has a fairly low bias, the histogram should approach more or less a normal distribution (bell-shaped) which one should try to achieve.
Strength in Numbers
No matter how well-trained an individual model is, there is still a significant chance that it could perform poorly or produce incorrect results. To train multiple instances of machine learning models and capture their collective wisdom in a way that would alleviate the potential issues produced by single models. there are two main approaches along these lines. Both use the principle of Strength in Numbers to reduce the potential error/bias of individual machine learning models. We use the strength of a large number of trained models with the purpose to improve the accuracy of predictions.
Ensemble Learning
It combines multiple machine learning models to produce one predictive model. There are three main types of ensemble algorithms:
Bagging or Bootstrap Aggregation
Helps reduce overfitting for models that tend to have high variance (such as decision trees)
Uses random subsampling of the training data to produce a bag of trained models.
The resulting trained models are homogeneous
The final prediction is an average prediction from individual models
2. Boosting
Helps reduce bias for models.
In contrast to bagging, boosting uses the same input data to train multiple models using different hyperparameters.
Boosting trains model in sequence by training weak learners one by one, with each new learner correcting errors from previous learners hence, constantly improving the model.
The final predictions are a weighted average from the individual models.
3. Stacking
Trains a large number of completely different (heterogeneous) models
Combines the outputs of the individual models into a meta-model that yields more accurate predictions
Strength in Variety: Automated ML
Automated Machine Learning plays on the principle of Strength in Variety and, as the name suggests, automates many of the iterative, time-consuming, tasks involved in model development (such as selecting the best features, scaling features optimally, choosing the best algorithms, and tuning hyperparameters). Automated ML allows data scientists, analysts, and developers to build models with greater scale, efficiency, and productivity — all while sustaining model quality. Automated ML explores combinations that help find the best performing combination to improve the accuracy of a prediction. Automated ML is not a replacement for a data scientist but a way to get a baseline model and then try other approaches to get superior performance.
Summary
In this lesson, you’ve learned to perform the essential data preparation and management tasks involved in machine learning:
Data importing and transformation
The use of datastores and datasets
Versioning
Feature engineering
Monitoring for data drift
The second major area we covered in this lesson was model training, including:
The core model training process
Two of the fundamental machine learning models: Classifier and regressor
The model evaluation process and relevant metrics
The final part of the lesson focused on how to get better results by using multiple trained models instead of a single one. In this context, you learned about ensemble learning and automated machine learning. You’ve learned how the two differ, yet apply the same general principle of “strength in numbers”. In the process, you trained an ensemble model (a decision forest) and a straightforward classifier using automated Machine Learning.
This short post highlights the structural nuances between popular normalization techniques employed while training deep neural networks.
I am hoping that a quick 2 minute glance at this would refresh my memory on the concept, sometime, in the not so distant future.
Let us establish some notations, that will make the rest of the content, easy to follow. We assume that the activations at any layer would be of the dimensions NxCxHxW (and, of course, in the real number space), where, N = Batch Size, C = Number of Channels (filters) in that layer, H = Height of each activation map, W = Width of each activation map.
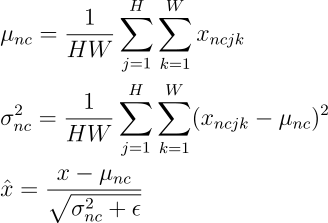
Generally, normalization of activations require shifting and scaling the activations by mean and standard deviation respectively. Batch Normalization, Instance Normalization and Layer Normalization differ in the manner these statistics are calculated.
Normalization
Batch Normalization
In “Batch Normalization”, mean and variance are calculated for each individual channel across all samples and both spatial dimensions.
Big Data Jobs
Instance Normalization
In “Instance Normalization”, mean and variance are calculated for each individual channel for each individual sample across both spatial dimensions.
Layer Normalization
In “Layer Normalization”, mean and variance are calculated for each individual sample across all channels and both spatial dimensions.
I firmly believe that pictures speak more than words, and I hope this post brings forth the subtle distinctions between several popular normalization techniques.