365 Data Science is an online educational career website that offers the incredible opportunity to find your way into the data science world no matter your previous knowledge and experience.
Artificial Intelligence has long been in existence, and it finds myriads of uses across the different business sectors. Coming to some of its unconventional methods, then AI finds application in environmental monitoring. Yes, we all know that AI, ML or IoT have increased their presence in our life in different ways, but only a few of us understand how dramatically these technologies have brought in the paradigm change. In recent years, we have seen companies realizing the growing importance of artificial intelligence training and machine learning training. The aim of these technologies is to enhance the functioning of the system and make them work more like a human. Well, it requires the expertise of expertise, and so we have a higher demand for artificial intelligence experts and ML experts. But, in this blog, we are going to highlight how IoT, ML and AI are making an impact on environmental monitoring.
Let’s explore the importance of AI, ML and IoT in environmental monitoring:
IoT can prove helpful in monitoring the environment by managing the energy and other resources that are being contaminated every day. If we go by the conventional methods of monitoring the methods, samples are collected, then analyzed analytically. There are two ways to collect and track this data. One if the manual process which is time taking and there is a higher probability of error. The second method is instrumental, wherein tools and software are used to assess the collected data and then come up with a result. If we compare the two methods, we can claim that instrumental methods are faster and also less prone to error.
When we talk about the IoT monitoring environment, then we are talking about waste management, weather conditions, resources, pollution level etc.
The next question that pops up is why do we need IoT for this and how it is going to create a difference. If we dig deeper into environmental monitoring, then it is way more profound than what we know. It requires the study of complex data that will highlight the critical factors impacting the environment and is there any set pattern of increased or decreased impact. While this can be studied using conventional methods, what we need is a deeper understanding of the same. To make the process flawless and faster, we need advanced systems like AI, ML and iot training.
A lot has been done in this domain. One such example is that of an air quality system that records the particulate matter or PM. This system categorizes PM into PM10, PM 2.5, and PM 1. When the particulate matter goes into the lungs, it can cause some severe health issues, hence keeping a check on the same plays an integral role. Standards are being implemented to monitor this and check on the factors that can impact the same.
Artificial Intelligence Jobs
Sensors are being used to assess the environment; these are :
1. Proximity sensors
2. Temperature sensors
3. Water quality sensors that keep a check on BOD, COD, pH and other microbial contaminants.
4. Gas sensors which assess the quality of air
5. Smoke sensors which are used for checking the industrial and environmental conditions in the more prone areas
How IoT and AI can prove helpful?
Pollution is one of the reasons that impact the productivity of the soil. Intensive use of pesticides does impact the environment. Thousands of people die every year because of the chemicals, and pesticides that are being used while farming. Implementation of AI and IoT for environmental sustainability includes methods like monitoring the crops, soil and crop production with low impact on the environment. With the help of these technologies we can aim to have safe agricultural methods which are going to increase productivity. For those smart monitoring devices and sensors can be attached to the crops to monitor their growth continuously. With the help of these sensors, we can assess the hydration needs of the plant, nutritional needs and based on it, healthier and safer agricultural methods can be adopted.
Another aspect of using AI and IoT is by protecting the species. We have vast biodiversity. And there are various species which are on the verge of extinction. With the help of the IoT and AI tools, we can study the different patterns in animals like feeding habits, migration and mating. It helps in keeping a track on animals without disrupting their normal life. A US-based company is using computer vision to detect the footprints of cheetahs, rhinos and other endangered species to know what is impacting their life or putting them in danger.
These are the few of the examples of the companies that are using AI, IoT and Ml in the field of environmental monitoring.
Conclusion
In the times to come, we are going to see greater use of these technologies. Hence, a rise in the demand for professionals in this field is going to rise. Opting for IoT training or artificial intelligent training or Machine Learning training is going to pave the way for a brighter future.
Global Tech Council is here to bring the changes and help you escalate the growth in your career by offering the right learning platform for AI, ML and IoT. To explore more connect with Global Tech Council today.
Many data science projects are launched with good intentions, but fail to deliver because the correct process is not understood. To achieve good performance and results in this work, the first steps must include clearly defining goals and outcomes, collecting data, and preparing and exploring the data. This is all about solving problems, which requires a systematic process.
Google is offering a new ML Engineer certificate, geared towards professionals who want to display their competency in topics like distributed model training and scaling to production. Is it worth it?
An easy guide to data pre-processing in Python; Monitoring Apache Spark with a better Spark UI; Computational Linear Algebra for Coders: the free course; Labelling data with Snorkel; Bayesian Statistics.
Moving sensitive data to the Cloud introduces the possibility of exposing data teams to new levels of risk, making it challenging to manage and prepare sensitive data for data science and analytics. Join our live webinar, Automating Security & Privacy Controls for Data Science & BI, Aug 12 @ 1PM ET to learn how Immuta for Databricks enables you to maximize the value of your sensitive data.
This curated collection of 5 natural language processing books attempts to cover a number of different aspects of the field, balancing the practical and the theoretical. Check out these 5 fantastic selections now in order to improve your NLP skills.
Microsoft Azure Machine Learning x Udacity — Lesson 2 Notes
Detailed Notes for Machine Learning Foundation Course by Microsoft Azure & Udacity, 2020 on Lesson 2 — Introduction to Machine Learning
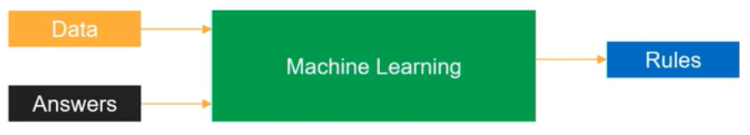
What is Machine Learning?
Machine learningis a data science technique used to extract patterns from data, allowing computers to identify related data, and forecast future outcomes, behaviors, and trends.
One important component of machine learning is that we are taking some data and using it to make predictions or identify important relationships. But looking for patterns
Applications
Health
Finance/Banking
Manufacturing
Retail
Government
Education
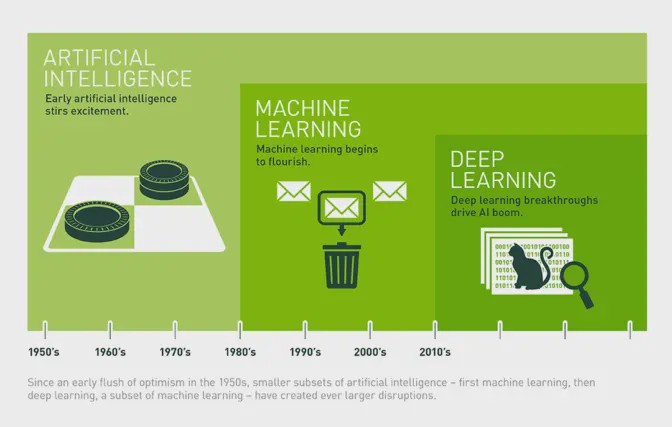
Brief History of Machine Learning
Artificial Intelligence:
A broad term that refers to computers thinking more like humans.
Machine Learning:
A subcategory of artificial intelligence that involves learning from data without being explicitly programmed.
Deep Learning:
A subcategory of machine learning that uses a layered neural-network architecture originally inspired by the human brain.
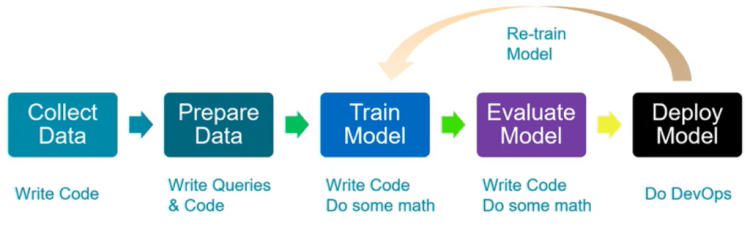
Data Science Process
Raw data, however, is often noisy and unreliable and may contain missing values and outliers. Using such data for modeling can produce misleading results. For the data scientist, the ability to combine large, disparate data sets into a format more appropriate for analysis is an increasingly crucial skill.
Collect Data: Query databases, call Web Services, APIs, scraping web pages.
Prepare Data: Clean data and create features needed for the model.
Train Model: Select the algorithm, and prepare training, testing, and validation data sets. Set-up training pipelines including feature vectorization, feature scaling, tuning parameters, model performance on validation data using evaluation metrics or graphs.
Evaluate Model: Test & compare the performance of models with evaluation metrics/graphs on the validation data set.
Deploy Model: Package the model and dependencies. Part of DevOps, integrate training, evaluation, and deployment scripts in respective build & release pipeline.
Artificial Intelligence Jobs
Common Types of Data
Numeric
Time-series
Categorical
Text
Images
Tabular Data
Data that is arranged in a data table and is the most common type of data in Machine Learning. is arranged in rows and columns. In tabular data, typically each row describes a single item, while each column describes different properties of the item. Each row describes a single product (e.g., a shirt), while each column describes a property the products can have (e.g., the color of the product)
Row: An item or entity.
Column: A property that the items or entities in the table can have.
Cell: A single value.
Vectors:
It is important to know that in machine learning we ultimately always work with numbers or specifically vectors.
A vector is simply an array of numbers, such as (1, 2, 3)—or a nested array that contains other arrays of numbers, such as (1, 2, (1, 2, 3)).
For now, the main points you need to be aware of are that:
All non-numerical data types (such as images, text, and categories) must eventually be represented as numbers
In machine learning, the numerical representation will be in the form of an array of numbers — that is, a vector
Scaling Data
Scaling data means transforming it so that the values fit within some range or scale, such as 0–100 or 0–1. This scaling process will not affect the algorithm output since every value is scaled in the same way. But it can speed up the training process.
Two common approaches to scaling data:
Standardization rescales data so that it has a mean of 0 and a standard deviation of 1. The formula for this is:
(? − ?)/?
Normalization rescales the data into the range [0, 1].
The formula for this is:
(? −????)/(???? −????)
Encoding Data
when we have categorical data, we need to encode it in some way so that it is represented numerically.
There are two common approaches for encoding categorical data:
Ordinal encoding: convert the categorical data into integer codes ranging from 0 to (number of categories – 1). One of the potential drawbacks of this approach is that it implicitly assumes an order across the categories.
One-hot encoding: transform each categorical value into a column. One drawback of one-hot encoding is that it can potentially generate a very large number of columns.
Image Data
An image consists of small tiles called pixels. The color of each pixel is represented with a set of values:
In grayscale images, each pixel can be represented by a single number, which typically ranges from 0 to 255. This value determines how dark the pixel appears (e.g., 0 is black while 255 is bright white).
In colored images, each pixel can be represented by a vector of three numbers (each ranging from 0 to 255) for the three primary color channels: red, green, and blue. These three red, green, and blue (RGB) values are used together to decide the color of that pixel. For example, purple might be represented as 128, 0, 128 (a mix of moderately intense red and blue, with no green).
Color Depth or Depth:
The number of channels required to represent a color in an image.
RGB depth = 3 (i.e each pixel has 3 channels)
Grayscale depth= 1
Encoding an Image:
We need to know the following three things about an image to in order to encode it:
Horizontal position of each pixel
Vertical position of each pixel
Color of each pixel
We can fully encode an image numerically by using a vector with three dimensions. The size of the vector required for any given image would be:
Size of Vector = height * weight * depth
Image Data is normalized to subtract per channel mean pixel values
In addition to encoding an image numerically, we may also need to do some other preprocessing steps. Generally, we would want to ensure the input images have:
Uniform aspect ratio
Normalized
Rotation
Cropping
Resizing
Denoising
Centering
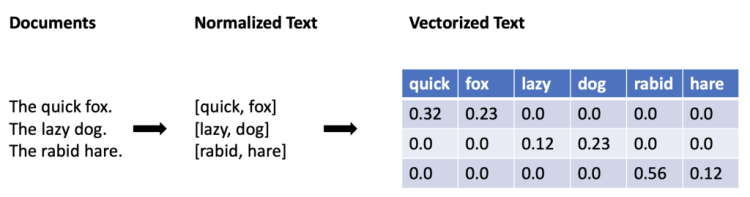
Text Data
Normalization:
Text normalization is the process of transforming a piece of text into its canonical (official) form.
Lemmatization: example of Normalization; the process of reducing multiple inflections to a single dictionary form
Lemma: dictionary form of a word e.g. is -> be
Stop-words: high-frequency unwanted words during the analysis
Tokenize: split each string of text into a list of smaller parts or tokens
Vectorization:
The next step after Normalization is to actually encode the text in a numerical form called vectorization. There are many different ways that we can vectorize a word or a sentence, depending on how we want to use it. Common approaches include:
Term Frequency-Inverse Document Frequency (TF-IDF) Vectorization: gives less importance to words that contain less information and are common in documents, e.g. the, and to give higher importance to words that contain relevant information and appear less frequently. It assigns weights to words that signify their relevance in the documents.
Word Embedding: Word2Vec, GloVe
Feature Extraction:
Vectors with length n can be visualized as a line in an n dimension space
Any vector with the same length can be visualized in the same space
The closeness of one vector to another can be calculated as Vector Space
Vectors close by can have a similar meaning or have some connection
Pipeline:
Here we will list how the above processes fit together to achieve a larger goal of training a machine-learning model to analyze text data.
Collection of documents and their labels
Text Normalization
Feature Extraction and Vectorization
Train Model (with above data)
Deploy
Two Perspectives on ML
As you can see, data plays a central role in how problems are modeled in machine learning. In very broad terms, we can think of machine learning as a matter of using some data (perhaps historical data that we already have on hand) to train a model. Then, once the model is trained, we can feed it new input data and have it tell us something useful.
So the general idea is that we create models and then feed data into these models to generate outputs. These outputs might be, for example, predictions for future trends or patterns in the data.
This idea draws on work not only from computer science but also statistics — and as a result, you will often see the same underlying machine learning concepts described using different terms. For example, a computer scientist might say something like:
We are using input features to create a program that can generate the desired output.
In contrast, someone with a background in statistics might be inclined to say something more like:
We are trying to find a mathematical function that, given the values of the independent variables can predict the values of the dependent variables.
While the terminology is different, the challenges are the same, that is how to get the best possible outcome.
The Computer Science Perspective
For the rows in the table, we call each row an entity or an observation about an entity. A row of data is also referred to as an instance.
For the columns in the table, we refer to each column as a feature or an attribute which describes the property of an entity.
The Statistical Perspective
The data is described in terms of independent variables and dependent variables. These names come from the idea that the value of one variable may depend on the value of some other variables.
From a statistical perspective, the machine learning algorithm is trying to learn a hypothetical function (f) such that:
Output Variable = f(Input Variables)
Typically, the independent variables are the input, and the dependent variables are the output. Thus, the above formula can also be expressed as:
Dependent Variable = f(Independent Variables)
Yet another way to represent this concept is to use shorthand notation. Often, the input variables are denoted as X and the output variable is denoted as Y:
Y = f(X)
The Tools for Machine Learning
The Machine Learning Ecosystem:
A typical machine learning ecosystem is made up of three main components:
1. Libraries. A library is a collection of pre-written (and compiled) code that you can make use of in your own project. NumPy is an example of a library popularly used in data science, while TensorFlow is a library specifically designed for machine learning.
2. Development environments. A development environment is a software application (or sometimes a group of applications) that provide a whole suite of tools designed to help you (as the developer or machine learning engineer) build out your projects. Jupyter Notebooks and Visual Studio are examples of development environments that are popular for coding many different types of projects, including machine learning projects.
3. Cloud services. A cloud service is a service that offers data storage or computing power over the Internet. In the context of machine learning, you can use a cloud service to access a server that is likely far more powerful than your own machine, or that comes equipped with machine learning models that are ready for you to use.
4. Notebooks: Notebooks are originally created as a documenting tool that others can use to reproduce experiments. Notebooks typically contain a combination of runnable code, output, formatted text, and visualizations. One of the most popular open-source notebooks used today by data scientists and data science engineers is Jupyter notebook, which can combine code, formatted text (markdown), and visualization.
5. End-to-end with Azure: You can analyze and train a small amount of data with your local machine using Jupyter notebook, Visual studio, or other tools. With very large amounts of data, or you need a faster processor, it’s a better idea to train and test the model remotely using cloud services such as Microsoft Azure.
Libraries for Machine Learning
Core Framework and Tools
Python is a very popular high-level programming language that is great for data science. Its ease of use and wide support within popular machine learning platforms, coupled with a large catalog of ML libraries, has made it a leader in this space.
Pandas is an open-source Python library designed for analyzing and manipulating data. It is particularly good for working with tabular data and time-series data.
NumPy, like Pandas, is a Python library. NumPy provides support for large, multi-dimensional arrays of data, and has many high-level mathematical functions that can be used to perform operations on these arrays.
Machine Learning and Deep Learning
Scikit-Learn is a Python library designed specifically for machine learning. It is designed to be integrated with other scientific and data-analysis libraries, such as NumPy, SciPy, and matplotlib (described below).
Apache Spark is an open-source analytics engine that is designed for cluster-computing and that is often used for large-scale data processing and big data.
TensorFlow is a free, open-source software library for machine learning built by Google Brain.
Keras is a Python deep-learning library. It provides an Application Programming Interface (API) that can be used to interface with other libraries, such as TensorFlow, in order to program neural networks. Keras is designed for rapid development and experimentation.
PyTorch is an open-source library for machine learning, developed in large part by Facebook’s AI Research lab. It is known for being comparatively easy to use, especially for developers already familiar with Python and a Pythonic code style.
Data Visualization
Plotly is not itself a library, but rather a company that provides a number of different front-end tools for machine learning and data science — including an open-source graphing library for Python.
Matplotlib is a Python library designed for plotting 2D visualizations. It can be used to produce graphs and other figures that are high quality and usable in professional publications. You’ll see that the Matplotlib library is used by a number of other libraries and tools, such as SciKit Learn (above) and Seaborn (below). You can easily import Matplotlib for use in a Python script or to create visualizations within a Jupyter Notebook.
Seaborn is a Python library designed specifically for data visualization. It is based on matplotlib, but provides a more high-level interface and has additional features for making visualizations more attractive and informative.
Bokeh is an interactive data visualization library. In contrast to a library like matplotlib that generates a static image as its output, Bokeh generates visualizations in HTML and JavaScript. This allows for web-based visualizations that can have interactive features.
Cloud Services for Machine Learning
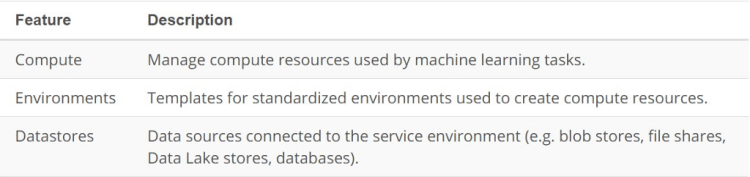
Typical cloud service for machine learning provides support for managing the core assets involved in machine learning projects. For your reference, you can see a table summarizing these main assets below.
Machine learning cloud services also need to provide support for managing the resources required for running machine learning tasks:
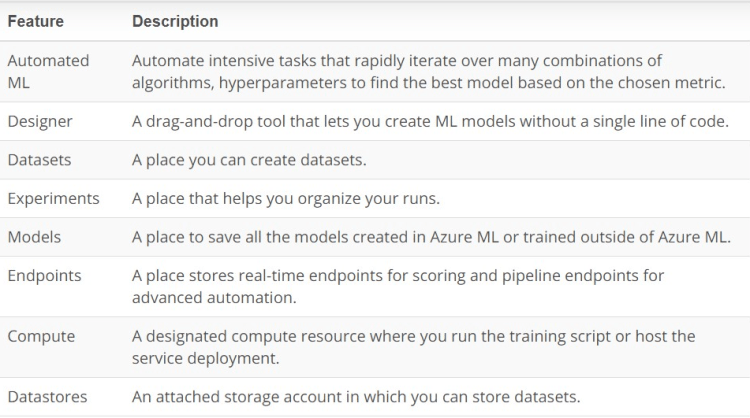
A Brief Intro to Azure Machine Learning:
A brief look at the main features of Azure ML workspace, a centralized place to work with all the artifacts you create:
Models vs. Algorithms:
Models (rules)
Modelsare thespecific representationslearned from data e.g. decision trees, set of coefficient outputs, what is learned by an algorithm on data. A machine learning model can also be written in a set of weights or coefficients instead of a full equation.
Algorithms (set of instructions)
Algorithmsare the processes oflearning e.g. Least Squares, which can be represented by any math equations. An algorithm is a mathematical tool that can usually be represented by an equation as well as implemented in code.
Model = Algo(Data)
Linear Regression:
An algorithm that uses a straight line (or plane) to describe relationships between variables.
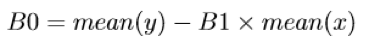
y = mx + b or y = B0 + B1 ∗ x
In algebraic terms, we may refer to mm as the coefficient of x or simply the slope of the line, and we may call bb the y-intercept. In machine learning, you will typically see the y-intercept referred to as the bias. Equations like these can be used to make predictions. Once we know m and b, we can feed in value for x and the equation will give us the value of y. In machine learning, the equation used for simple linear regression.
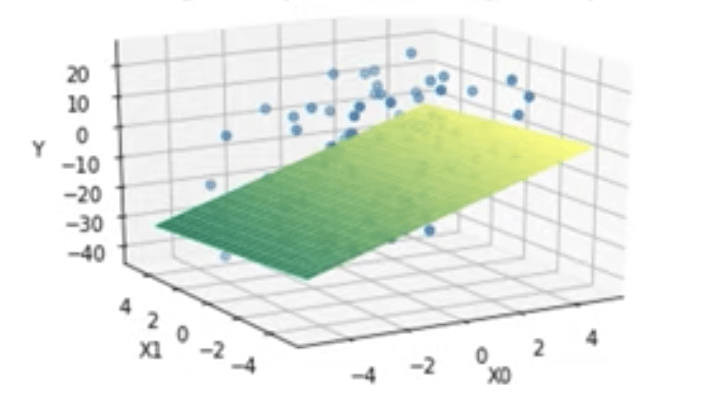
In more complex cases where there is more than one input variable, we might see something like this:
In this case, we are using multiple input variables to predict the output. When we have multiple input variables like this, we call it multiple linear regression. The visualization of multiple linear regression is no longer a simple line, but instead a plane in multiple dimensions:
Training a Linear Regression Model:
To train a linear regression model” simply means to learn the coefficients and bias that best fit the data.
The Cost Function:
When we make a prediction using the line, we expect the prediction to have some error. The process of finding the best model is essentially a process of finding the coefficients and bias that minimize this error. To calculate this error, we use a cost function. The most commonly used cost function for linear regression is the root mean squared error (RMSE)
Preparing Data:
There are several assumptions or conditions you need to keep in mind when you use the linear regression algorithm. If the raw data does not meet these assumptions, then it needs to be prepared and transformed prior to use.
Linear Assumption: The relationship between the input variables and the output variable needs to be a linear relationship. If the raw data does not follow a linear relationship, you may be able to transform your data prior to using it with the linear regression algorithm.
Remove Collinearity: When two variables are collinear, this means they can be modeled by the same line or are at least highly correlated; in other words, one input variable can be accurately predicted by the other. Having highly correlated input variables will make the model less consistent, so it’s important to perform a correlation check among input variables and remove highly correlated input variables.
Gaussian (normal) Distribution: The distance between output variables and real data (called residual) is normally distributed. If this is not the case in the raw data, you will need to first transform the data so that the residual has a normal distribution.
Rescale Data: Linear regression is very sensitive to the distance among data points, so it’s always a good idea to normalize or standardize the data.
Remove Noise: Linear regression is very sensitive to noise and outliers in the data. Outliers will significantly change the line learned. Thus, cleaning the data is a critical step prior to applying linear regression.
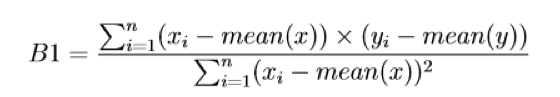
Calculating the Coefficients:
We take the general equation for a line and use some data to learn the coefficients for a specific line that will best fit the data.
The formula for getting the slope of the line looks something like this:
To get the intercept, we calculate:
And to get the root mean squared error (RMSE), we have:
Learning Functions
The goal is to learn a useful transformation of the input data that gets us closer to the expected output.
Irreducible Error:
The variable e is called irreducible error because no matter how good we get at estimating the target function (f), we cannot reduce this error. It is caused by the data collection process — such as when we don’t have enough data or don’t have enough data features.
Y = f(X) + e
Variable e is the error, no matter how good the algorithm gets, this error remains. It comes which data collection process.
Model Error:
The model error measures how much the prediction made by the model is different from the true output. The model error is generated from the model and can be reduced during the model learning process.
error = prediction - target
Parametric vs. Non-parametric
Based on the assumptions about the shape and structure of the function they try to learn, machine learning algorithms are categorized as:
Parametric:
Simplify the mapping to a known form and a fixed number of variables, e.g. Linear Regression.
Benefits:
Simpler and easier to understand; easier to interpret the results
Faster when talking about learning from data
Less training data required to learn the mapping function, working well even if the fit to data is not perfect
Limitations:
Highly constrained to the specified form of the simplified function
Limited complexity of the problems they are suitable for
Poor fit in practice, unlikely to match the underlying mapping function.
Non-parametric:
Not making assumptions regarding the form of the mapping between input & output data. They are free to learn any functional form from training data, e.g. K-Nearest Neighbors.
Benefits:
High flexibility, in the sense that they are capable of fitting a large number of functional forms
Power by making weak or no assumptions on the underlying function
High performance in the prediction models that are produced
Limitations:
More training data is required to estimate the mapping function
Slower to train, generally having far more parameters to train
Overfitting the training data is a risk; overfitting makes it harder to explain the resulting predictions
Classical ML vs. Deep Learning
All deep learning algorithms are machine learning algorithms but not all machine learning algorithms are deep learning algorithms. Deep learning algorithms are based on neural networks and the classical ML algorithms are based on classical mathematical algorithms.
Deep learning advantages:
Suitable for high complexity problems
Better accuracy, compared to classical ML
Better support for big data
Complex features can be learned
Deep learning disadvantages:
Difficult to explain trained data
Require significant computational power
Classical ML advantages:
More suitable for small data
Easier to interpret outcomes
Cheaper to perform
Can run on low-end machines
Does not require large computational power
Classical ML disadvantages:
Difficult to learn large datasets
Require feature engineering
Difficult to learn complex functions
Approaches to Machine Learning
There are three main approaches to machine learning:
Supervised Learning
Learns from data that contains both the inputs and expected outputs (e.g., labeled data). It is a passive process where learning is performed without any actions that could influence the data. Common types are:
Classification: Outputs are categorical.
Regression: Outputs are continuous and numerical.
Similarity Learning: Learns from examples using a similarity function that measures how similar two objects are.
Feature Learning: Learns to automatically discover the representations or features from raw data.
Anomaly Detection: A special form of classification, which learns from data labeled as normal/abnormal.
Unsupervised Learning
Learns from data that contains both the inputs and expected outputs (e.g., labeled data). It is also a passive process. Common types are:
Classification: Outputs are categorical.
Regression: Outputs are continuous and numerical.
Similarity Learning: Learns from examples using a similarity function that measures how similar two objects are.
Feature Learning: Learns to automatically discover the representations or features from raw data.
Anomaly Detection: A special form of classification, which learns from data labeled as normal/abnormal.
Reinforcement Learning
Learns how an agent should take action in an environment in order to maximize a reward function. It s an active process where the actions of the agent influence the data observed in the future, hence influencing its own potential future states.
Markov Decision Process: A mathematical process to model decision-making in situations where outcomes are partly random and partly under the control of a decision-maker. Does not assume knowledge of an exact mathematical model.
Trade-Offs
Bias vs. Variance:
Bias: measures how inaccurate the model prediction is in comparison with the true output. It is due to erroneous assumptions made in the machine learning process to simplify the model and make the target function easier to learn. High model complexity tends to have low bias.
Variance: measures how much the target function will change if different training data is used. Variance can be caused by modeling the random noise in the training data. High model complexity tends to have a high variance.
Parametric/Linear Algorithms: high bias, low variance
Non-parametric/Non-linear Algorithms: low bias, high variance
Overfitting vs. Underfitting:
Overfitting: refers to the situation in which models fit the training data very well, but fail to generalize to new data.
Underfitting: refers to the situation in which models neither fit the training data nor generalize to new data.
Prediction Error:
The prediction error can be viewed as the sum of model error and the irreducible error.
Low Bias: Fewer assumptions about target functions. Having fewer assumptions can help generalize relevant relations between features and target outputs, e.g. Decision Trees, K-Nearest Neighbors.
High Bias: More assumptions about target functions. Having more assumptions can potentially miss important relations between features and outputs and cause underfitting, e.g. Linear, Logistic Regression.
Low Variance: changes in training data would result in similar target functions, e.g. Linear Regression, Latent Dirichlet Analysis.
High Variance: changes in training data would result in very different target functions. High variance suggests that the algorithm learns the random noise instead of the output and causes overfitting, e.g. Support Vector Machines.
The goal of training machine learning models is to achieve low bias and low variance. The optimal model complexity is where bias error crosses with variance error.
Limit Overfitting:
Use a resampling technique like k-fold cross-validation
Hold back a validation dataset from the initial training data to estimate how well the model generalizes on new data.
Simplify the model
Use more data if available
Reduce dimensionality in a training dataset. It projects training data into a smaller dimension to decrease the model complexity.
Stop the training early when the performance on the testing dataset has not improved after a number of training iterations.
Lesson Summary
In this lesson, our goal was to give you a high-level introduction to the field of machine learning, including the broader context in which this branch of computer science exists.
Main topics we covered:
What machine learning is and why it’s so important in today’s world
The historical context of machine learning
The data science process
The types of data that machine learning deals with
The two main perspectives in ML: the statistical perspective and the computer science perspective
The essential tools needed for designing and training machine learning models
The basics of Azure ML
The distinction between models and algorithms
The basics of a linear regression model
The distinction between parametric vs. non-parametric functions
The distinction between classical machine learning vs. deep learning
The main approaches to machine learning
The trade-offs that come up when making decisions about how to design and training machine learning models
In the process, you also trained your first machine learning model using Azure Machine Learning Studio.
Statistics Related Interview Questions Usually asked In Field of Data Science, Machine Learning, Deep Learning……….
How You are Going to Fix the Missing Values in a DataSet?
→ Your Approach Should be to check Whether the Features in the dataset is Following a Normal (Symmetric) Distribution Curve or Skewed.
if The Dataset is Skewed then we will replace it with the Median Value, because the Median is not affected by the Outliers.
if The Dataset is Following a Normal (Symmetric) Distribution then we can replace it with any of the terms (i.e. Mean, Median, Mode).
What is the Central Mode of Tendency?
→ Central Mode of Tendency is a Single term that represents the whole data. The most common Central Mode of Tendencies are Mean, Median, Mode.
What is Central Limit Theorem?
→ The central limit theorem states that if you have a population with mean μ and standard deviation σ and take sufficiently large random samples from the population with replacement, then the distribution of the sample means will be approximately normally distributed.
Artificial Intelligence Jobs
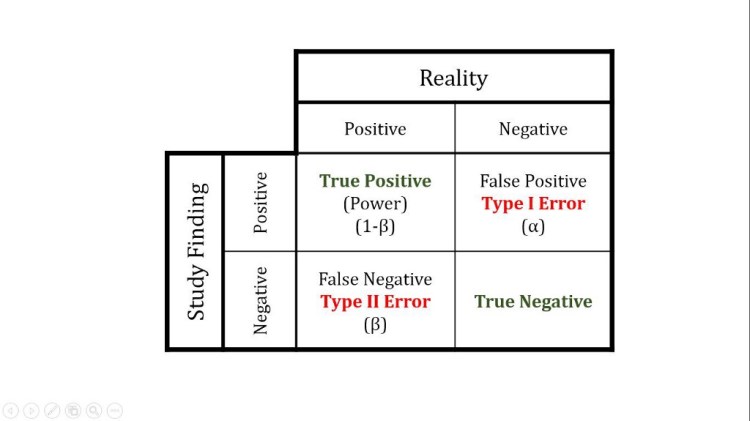
What is Type I and Type II Error?
A type 1 error is also known as a false positive and occurs when a researcher incorrectly rejects a true null hypothesis.
A type II error is also known as a false negative and occurs when a researcher fails to reject a null hypothesis which is really false.
What is Inferential Statistics?
→ The process of using data analysis to deduce the properties of an underlying distribution of probability. Inferential statistical analysis infers properties of a population, for example by testing hypotheses and deriving estimates.
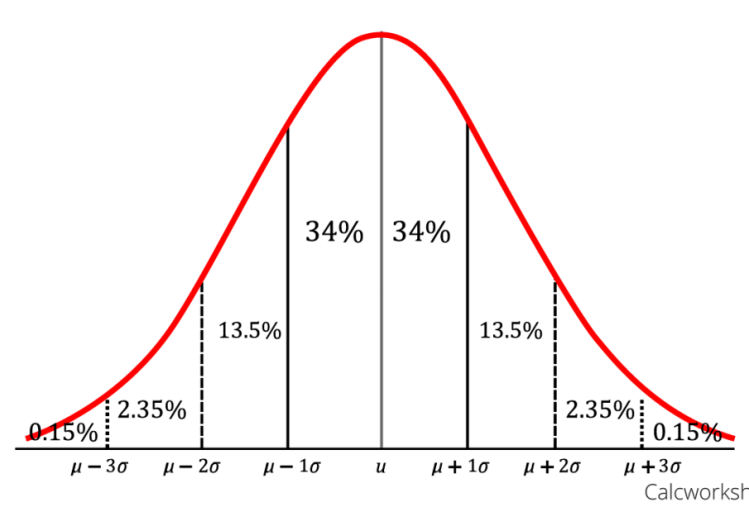
What is the Empirical Formula?
→ 68 Percentile of the Distribution is Covered between μ-σ and μ+σ.
→ 95 Percentile of the Distribution is Covered between μ-2σ and μ+2σ.
→ 99.7 Percentile of the Distribution is Covered between μ-3σ and μ+3σ.
→ The measure of Variability describes the spread of the Dispersion of the Dataset.
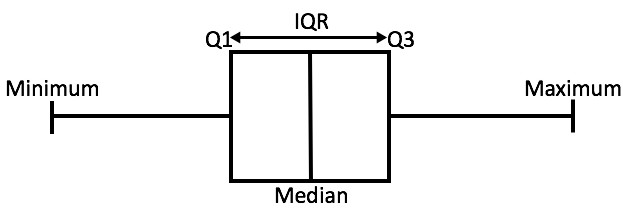
What is Quartile?
→ The measure of Central Tendency that divides a group of data into 4 SubGroups.
What is the Inter-Quartile Range?
→ The difference between the first and the third Quartile is known as the Inter-Quartile Range. (Q3-Q1)
What is Feature Engineering?
→ Feature engineering is the process of using domain knowledge to extract features from raw data via data mining techniques. These features can be used to improve the performance of machine learning algorithms.
What is Exploratory Data Analysis (EDA)?
→ Exploratory data analysis is an approach to analyzing data sets to summarize their main characteristics, often with visual methods. A statistical model can be used or not, but primarily EDA is for seeing what the data can tell us beyond the formal modeling or hypothesis testing task.
What is Principal Component Analysis?
→ the principal component analysis is a method to project data in a higher-dimensional space into a lower-dimensional space by maximizing the variance of each dimension.
How can you Prevent Overfitting?
→ Removing Irrelevant Features.
→ Data Augmentation.
→ Cross-Validation.
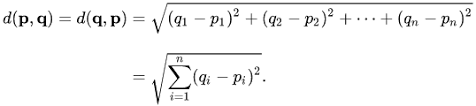
What is Euclidean Distance?
→ the Euclidean distance or Euclidean metric is the “ordinary” straight-line distance between two points in Euclidean space.
With more people being involved in online social networking every day, social media have become an indispensable part of marketing strategies for businesses of all kinds. According to the Global State of Digital Report, there were 4.388 billion internet users worldwide in 2019, and 79% of them were active social users. When used strategically, social media marketing can contribute to a company’s revenue, engagement and awareness, but simply being on social media does not mean making use of all that social media have in store for businesses. What really matters is the way you use social channels, and that’s where opportunities may be revealed through machine learning.
We’re going through the explosion of data, but this data is useless unless it’s analyzed. Machine learning makes it possible to analyze limitless data sets and find patterns hidden behind them. Typically deployed with the help of machine learning consultants, this technology improves the way data is transformed into knowledge and enables businesses to make accurate predictions and fact-based decisions.
These are not all of the benefits, so let’s have a closer look at the other business facets that can be improved with machine learning.
Brand monitoring
Business success today is determined by a number of factors, and perhaps one of the most impactful of them is online reputation. According to the Local Consumer Review Survey, 82% of consumers check out online reviews for businesses, with each reading 10 reviews on average before trusting a business. This proves that good publicity is crucial for brands, that’s why executives need to find a way to manage business reputation effectively.
Artificial Intelligence Jobs
Brand monitoring is a perfect solution, which is the search of any mentions of a brand in all available sources, including social media, forums, blogs, online reviews, and articles. Allowing businesses to spot problems before they grow into crises and react in time, brand monitoring also gives executives a thorough understanding of their target audience, and thus contributes to better decision making.
How machine learning helps
As the foundation for predictive analytics, machine learning contributes to decision makers’ thorough understanding of all the processes going on in their companies, so that their decisions become more data-driven and customer-oriented, and thus more effective.
Now think about all the mentions of your business available online — how many of them will there be? Hundreds? Thousands? Collecting and analyzing them manually is hardly a manageable challenge, while machine learning speeds up the process and provides a brand’s most detailed review.
Unless unhappy customers contact you directly by phone or email, the fastest way to find and assist them is sentiment analysis — the set of machine learning algorithms that evaluate public opinion about your business. In particular, brand mentions are filtered by negative or positive context so that your business can quickly react to cases that can affect your brand. Deploying machine learning lets businesses track customers’ opinions regardless of the language in which they are written, which expands the area of monitoring.
Target audience research
An online profile may tell a number of things, such as its owner’s age, gender, location, occupation, hobbies, income, shopping habits, and more, which makes social media an endless source for businesses to collect data about their current customers and people whom they would like to engage. Thus, marketing managers gain an opportunity to learn about their audience, including the way the company’s product or services are used. This facilitates the process of finding product faults and reveals ways in which a product may be evolved.
This can also be applied to B2B relationships: based on such criteria as company size, annual revenues, and number of employees, B2B customers are segmented into groups, so that the vendor doesn’t need to find a one-size-fits-all solution but target different segments using an approach most suitable for a particular group.
Marketing specialists have enormous amounts of data to deal with — collected from a number of sources, it may appear to be endless when it comes to customer profiling and audience analysis. By deploying machine learning, companies ease the process of analyzing various channels and extracting valuable information from them. This way, your employees can use ready-made data to rely on when segmenting the customers.
Also, machine learning algorithms can reveal behavioral patterns of this or that group of customers, giving companies an opportunity to make more precise predictions and use those to their strategic advantage.
Image and video recognition
In 2020, image and video recognition comes as an emerging technology necessary for all companies who want to have a competitive edge. Social media, and especially networks like Facebook and Instagram, provide an unlimited number of photos and videos being posted by your potential customers every day, if not every minute.
First of all, image recognition allows companies to identify users’ favorite products. With this information considered, you’ll be able to effectively target your marketing campaigns to upsell and cross-sell if a person is already using your product, and encourage them to try it out at a more attractive price if they are using a competitor’s product. Also, the technology contributes to the understanding of your target audience, as pictures sometimes may tell much more about one’s income, location and interests than a poorly filled profile.
Another way in which businesses can benefit from image and video recognition is finding new ways their product may be used. The internet today is full of photos and videos of people who conduct experiments and do unusual things using the most common products in a completely new way — so why not make use of it?
How machine learning helps
Machine learning is an indispensable part of image and video recognition, which is based on constant training that may only be possible by employing the right algorithms and making the system remember the patterns.
Still, images and videos that appear to be useful first need to be found among enormous volumes of information available on social media, and that’s when machine learning facilitates the mission that’s almost impossible if done manually. Boosted with advanced machine learning technologies, image recognition may foster businesses toward a completely new level of targeting, providing unique insights about customers and the way they use products.
Customer targeting and support via chatbots
More and more people today recognize messaging as the most convenient way to socialize, which gives companies new opportunities to engage customers. With the rise of chats in general and chatting apps like WhatsApp and Facebook Messenger, chatbots are becoming an effective marketing tool — they process information of all kinds and can serve to respond to various requests: from standard questions to tasks involving a number of variables.
Unlike usual navigation links and web pages, chatbots provide users with an ability to search and explore using a social network or a messaging app they prefer. And while traditional digital marketing typically engages through images, text, and video, bots make it easy for brands to connect to each customer directly and build a personal human-like dialogue.
Chatbots boosted with ML
Most chatbots run on machine learning algorithms. If a chatbot is a task-oriented one, though, it can use neuro-linguistic programming and rules to deliver structured responses to the most general requests without requiring machine learning to support its basic capabilities.
At the same time, there are predictive data-driven chatbots — acting as intelligent assistants, they learn on the go to provide relevant answers and recommendations, and some can even imitate emotions. Data-driven chatbots are powered by machine learning, as they are constantly trained, evolving and analyzing users’ preferences. Together, these facts make users’ interaction with a business more personalized: asking questions, providing relevant information, empathizing, and joking, chatbots appeal to what’s out of reach for traditional ads.
With intelligent chatbots, businesses can assist an unlimited number of customers wherever and whenever they are. Saving money and time and improving customer experience, chatbots are becoming one of the most beneficial AI areas to invest in for mid-size businesses and enterprises.
If you are interesting in becoming better at statistics and machine learning, then some time should be invested in diving deeper into Bayesian Statistics. While the topic is more advanced, applying these fundamentals to your work will advance your understanding and success as an ML expert.