365 Data Science is an online educational career website that offers the incredible opportunity to find your way into the data science world no matter your previous knowledge and experience.
7 Best Tableau Online Courses for Data Science and Visualization
Also Includes courses to become Tableau Certified Associate and Desktop Specialist
In the era of Big Data and Data Science, Data Visualization and Analytics have become really important. Data visualizations like dashboards and charts help you to better understand the data and provides you insights.
They also help simplify complex data sets into concise images and diagrams that clients and users can more easily digest. What would you do with the data if you cannot analyze it to gain the insights which can help with your business growth and some path-breaking discoveries and that’s where Data Visualization and Analytics tools like Tableau helps a lot.
Tableau allows you to explore, experiment, fix, prepare, and present data easily, quickly, and beautifully. It’s both a data visualization and analytics tool.
It also works efficiently with a massive set of data that presents its own challenges. Analyzing terabytes and petabytes of data can be daunting, and not every tool can handle that.
In short, Data visualization and Analytics are critical in this era of Big Data and Data Science, and that’s why to recommend every data scientist have some data visualization skills and analytical skills. Hence, knowledge of powerful tools like Tableau is a must for any Data Scientist or Big Data Developers.
In this article, I am going to share some of the best Tableau online courses and certifications which you can take to learn Tableau on your own. Most of the most curses will teach visualization through Tableau 10 helps you to discover data patterns such as customer purchase behavior, sales trends, or production bottlenecks, which is what most of your client needs.
Big Data Jobs
You’ll also learn all of the essential features of Tableau to deal with data better. I had no prior experience with Tableau, but I was able to follow along very well so far. So, these courses are definitely well-suited for beginners, but I can also say that developers with Tableau skills can also learn a few things by following along.
7 Best Courses to Learn Tableau for Programmers and Data Scientist
Without wasting any more of your time, here is my list of some of the best online courses and certifications to learn Tableau. It includes Tableau courses from Coursera, Udemy, and Pluralsight, which will teach you how to quickly and easily develop insights from your Big Data.
These courses cover all the basics of Big Data systems, and they are also very hands-on in teaching Tableau Software’s powerful analytics platform.
This is one of the first courses I took on to learn Tableau. I was inspired by Kirill Eremenko, whose Data Science course was one of my favorite trails on Udemy, and this course didn’t disappoint me a tall. It’s actually one of the best courses to learn Tableau 2020 for Data Science.
It provides step-by-step tutorials, examples, and Real-Life Data Analytics Exercises and quizzes, which really helps to learn Tableau. I firmly believe that until you do exercises, write your own models, you won’t learn, and this course is structured to promote learn-by-doing phenomena.
Talking about social proof, more than 157,225 people have already learned from this course. It also has, on average, 4.6 ratings from 40,000 participants, which speak volumes about its excellent. Apart from English, the course is also available in German, Indonesian, Polish, Romanian, French and Italian
Another resource which I highly recommend to data scientist is the data visualization specialization offered by UC Davis or the University of California.
Like other Course specialization, which focuses on teaching you skill by combining related courses, this specialization also covers 5 following courses:
1. Fundamentals of Visualization with Tableau 2. Essential Design Principles for Tableau 3. Visual Analytics with Tableau 4. Creating Dashboards and Storytelling with Tableau 5. Data Visualization with Tableau Project
You can see, each of the courses is a gem and its structure really well to teach from basics to the capstone project. Like other courses specialization, you don’t need to pay to access this course unless you need a certificate. Though, I highly recommend this specialization and Tableau certification if you are looking for a job with Tableau skills.
This is one of the advanced courses to learn Data Mining and Tableau 20 in Data Science by solving Real-Life Analytics Problems. This course will help you learn Visualisation and Data Mining by actually doing it.
It’s like the second part of the basic course “Tableau 20 A-Z: Hands-On Tableau Training For Data Science!” by Kirill Eremenko and also expect that you have Tableau Desktop or Tableau Public installed.
If you are looking for some solid practice with Real-Life Analytics Problems, then this course is for you. I strongly recommend this to get hands-on experience before you appear for any Tableau interviews.
Talking about social proof, more than 59,747 students have already benefitted from this course, and it has, on average, 4.7 ratings from close to 6,410 rating participants, which are simply phenomenal. Still, no surprise gave me the experience and knowledge of Kirill Eremenko and the SuperDataScience Team.
This is one of the best course to start with Tableau on Pluralsight. In this course, Ben explains the evolution of Big Data systems, as well as the various architectures and popular vendors in this space.
After learning the fundamentals of Big Data systems, you will also learn how to use Tableau software to work with your Big Data and visualize in ways that will leave your clients praising.
Though, you would need a Pluralsight membership to access this course, which costs around $29/month or $299/year but also provides you access to 5000+ highest quality online courses to learn all modern technologies.
You can also check out this course by taking their 10-day free trial period, which provides access to all of their online courses and 200 minutes of watch time.
This is one of the best courses to learn Fundamentals of Visualization with Tableau from the University of California, Davis, on Coursera.
This is also the first course of the Data Visualization specialization, and it will not only teach you what data visualization is, and how you can use it to better see and understand data but also how to use Tableau for that.
You will learn the fundamental concepts of data visualization and explore the Tableau interface, identifying and applying the various tools Tableau has to offer. I highly recommend you to join this course if you are new to tableau and also take all other courses from specialization.
This is another comprehensive course by Philip Burton on Udemy to learn Tableau in depth. In this course, you will go from beginners to skills needed for Certified Associate or Desktop Specialist certifications.
Here are the main things you will learn in this course:
How to install and run the full version of Tableau Public, the BI, and analysis software.
How to create analyses, such as line charts, stacked bar charts, or geographic analyses using maps.
How to tell a story using storyboards.
How to format numbers and dates, and add labels, tooltips, and animation.
How to use advanced Tableau features, like Calculated Fields, Parameters, and Hierarchies.
The course is recorded on a combination of Tableau 2018, 2019, and 2020, but most of it will also work on Tableau 10 and Tableau 9. After completing this course, you will, with some experience, have the knowledge to take (and pass) the Tableau Qualified Associate certification.
If you are preparing for Tableau Specialist exam certification then this is the best online course you can join to start your preparation. This course contains everything you need to become the Tableau Specialist.
It includes lectures covering all exam guide topics, downloadable study guides, and THREE full-length practice exams! to build and assess your speed and accuracy.
Here are the main topics you will learn in this course
Connecting to & Preparing Data
Exploring & Analyzing Data
Sharing Insights
Understanding Tableau Concepts
If you want to become a Tableau Desktop Specialist and looking for a complete course then you should join this course, you won’t regret it.
That’s all about some of the best online courses to learn Tableau for Programmers and Data Scientist. You can use these courses to not only learn Tableau but also earn certification to showcase your Tableau skills and experience in places where it matters like your LinkedIn profile and resume. This will not only help you to get the job where Tableau is a required skill but also help you to establish your authority in this competitive world.
Thanks for reading this article so far. If you like these Tableau online courses and certifications, then please share it with your friends and colleagues. If you have any questions or feedback or any other online training course on Tableau which you want to share with us, feel free to drop a note.
P. S. — If you are new into Tableau world and looking for a free course to learn Tableau then you can also join Tableau Tutorial for Beginners by Rakesh Gopalkrishnan on Udemy. It’s a completely free course and you just need a free Udemy account to join this course. More than 47,000 people have already joined this course. Big thanks to Rakesh for keeping this course FREE.
With more professionals from a wide range of less technical fields diving into statistical analysis and data modeling, these experimental techniques can seem daunting. To help with these hurdles, this article clarifies some misconceptions around p-values, hypothesis testing, and statistical significance.
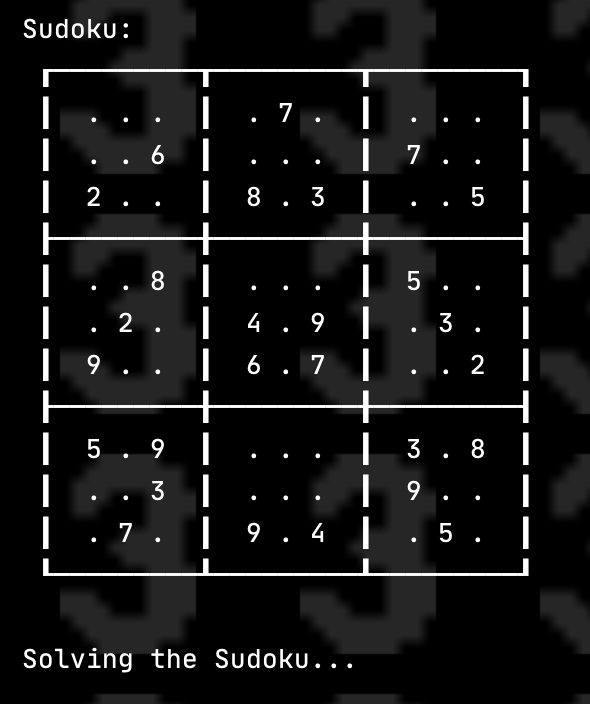
We will be creating a Sudoku Solver AI using python and Open CV to read a Sudoku puzzle from an image and solving it. There a lot of methods to achieve this goal. Thus in this series, I have compiled the best methods I could find/research along with some hacks/tricks I learned along the way.
Before and End of Part 2: Left and right respectively
Steps
Import the image
Pre Processing the Image 2.1 Gaussian blur: We need to gaussian blur the image to reduce noise in thresholding algorithm 2.2 Thresholding: Segmenting the regions of the image 2.3 Dilating the image: In cases like noise removal, erosion is followed by dilation.
Sudoku Extraction 3.1 Find Contours 3.2 Find Corners: Using Ramer Doughlas Peucker algorithm / approxPolyDP for finding corners 3.3 Crop and Warp Image: We remove all the elements in the image except the sudoku 3.4 Extract Cells
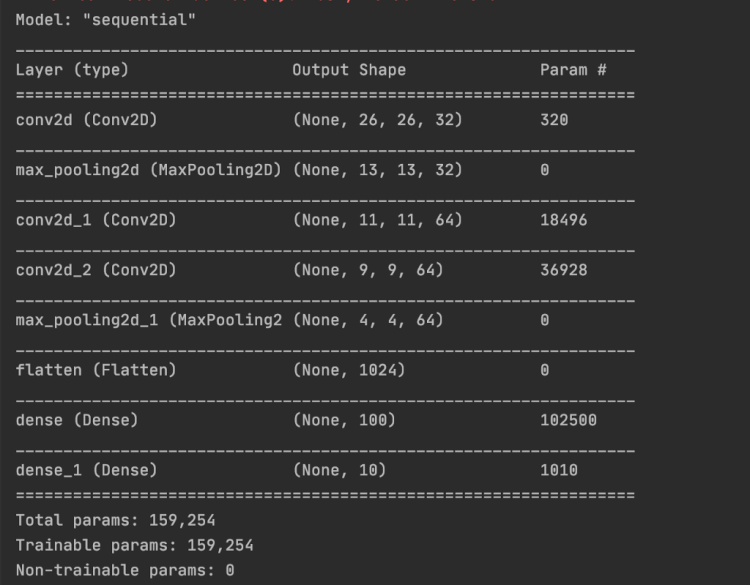
Interpreting the Digits 4.1 Import the libraries and load the dataset 4.2 Preprocess the data 4.3 Creating the Model 4.4 Predicting the digits
Solving the Sudoku
4. Interpreting the Digits
At the end of Part 2: Sudoku and Cell Extraction we had converted the image into a 2-D array of the images of the cells.
We will use Deep Learning and MNIST dataset for recognizing the digits. The MNIST dataset contains 60,000 small square 28×28 pixel grayscale training images of handwritten digits from 0 to 9 and 10,000 images for testing. So, the MNIST dataset has 10 different classes.
Before starting anything, make-sure Tensorflow is installed on your computer. We need to import all the modules that we are going to need for training our model. The Keras library already contains some datasets and MNIST is one of them. So we can easily import the dataset through Keras. The mnist.load_data() method returns the training data, its labels along with the testing data and its labels.
import keras
from keras.datasets import mnist
from keras.models import Sequential
from keras.layers import Dense, Dropout, Flatten
from keras.layers import Conv2D, MaxPooling2D
from keras import backend as K
# the MNIST data is split between train and test sets
(X_train, y_train), (X_test, y_test) = mnist.load_data()
4.2 Preprocess the data
The dimension of the training data is (60000, 28, 28). CNN accepts four dimensions. So we need to reshape the images to have dimensions (samples*pixels*width*height) and normalize the data.
# Reshape to be samples*pixels*width*height
X_train = X_train.reshape(X_train.shape[0], 28, 28, 1).astype('float32')
X_test = X_test.reshape(X_test.shape[0], 28, 28, 1).astype('float32')

# One hot Cpde
y_train = np_utils.to_categorical(y_train)
y_test = np_utils.to_categorical(y_test)
num_classes = y_test.shape[1]

# convert from integers to floats
X_train = X_train.astype('float32')
X_test = X_test.astype('float32')
# normalize to range [0, 1]
X_train = (X_train / 255.0)
X_test = (X_test / 255.0)
We need to preprocess the image and extract the number before making a prediction.
thresh = 128 # define a threshold, 128 is the middle of black and white in grey scale # threshold the image gray = cv2.threshold(image, thresh, 255, cv2.THRESH_BINARY)[1]
if (x < 3 or y < 3 or h < 3 or w < 3): # Note the number is always placed in the center # Since image is 28x28 # the number will be in the center thus x >3 and y>3 # Additionally any of the external lines of the sudoku will not be thicker than 3 continue ROI = gray[y:y + h, x:x + w] # increasing the size of the number allws for better interpreation, # try adjusting the number and you will see the differnce ROI = scale_and_centre(ROI, 120)
tmp_sudoku[i][j] = predict(ROI)
Extracting digit
The predict function will take the number image. We will reshape it and make the prediction using our model.
# plt.imshow(image.reshape(28, 28), cmap='Greys') # plt.show() model = load_model('cnn.hdf5') pred = model.predict(image.reshape(1, 28, 28, 1), batch_size=1) # return pred.argmax()
Predicted NumberUnsolved Sudoku
5. Solving the sudoku
We will be using Constraint Programming to solve the Sudoku. The python-constraint has features of adding constraints and variables to solve the problem. We will use constraint.Problem to create the Problem
import constraint
problem = constraint.Problem()
There are 4 constraints that we need to add in the the problem: SYNTAX: addConstraint(which_constraint, list_of_variable_order)
Every Row cell should have different value
for i in range(1, 10):
    problem.addConstraint(constraint.AllDifferentConstraint(), range(i * 10 + 1, i * 10 + 10))
2. Every column cell should have different value
# 2. Every column should have different value
for i in range(1, 10):
    problem.addConstraint(constraint.AllDifferentConstraint(), range(10 + i, 100 + i, 10))
3. Every sub-block cell should have different value
for i in [1, 4, 7]:
    for j in [1, 4, 7]:
        square = [10 * i +j, 10 * i + j +1, 10 * i + j +2,
                  10 *( i + 1 ) +j, 10 *( i + 1 ) + j +1, 10 *( i + 1 ) + j +2,
                  10 *( i + 2 ) +j, 10 *( i + 2 ) + j +1, 10 *( i + 2 ) + j +2]
        # ex: 11, 12, 13, 21,22,23, 31,32,33 have to be different
        problem.addConstraint(constraint.AllDifferentConstraint(), square)
4. Adding the numbers already in the sudoku
# 4. Adding the numbers already in the sudoku
for i in range(9):
    for j in range(9):
        if sudoku[i][j] != 0:
            # this is a constraint method. There are a lot of ways to add constraints this is one of them
            # it helps us check if the number is equal to the suodoku value
            # SYNTAX: addConstraint(which_constraint, list_of_variable_order)
            def constraint(variable_value, value_in_table = sudoku[i][j]):
                if variable_value == value_in_table:
                    return True

            problem.addConstraint(constraint, [(( i +1 ) *10 + ( j +1))])
The solutions can be calculated by using problem.getSolutions()
solutions = problem.getSolutions()
There can be multiple solutions, no solution, or one solution. The number of solutions is equal to the len(solutions) . We will use the first solution and store it in a 2-D array.
sudoku_solv =[[0 for x in range(9)] for y in range(9)]
solavble = False

# if there is no solution to the problem
if len(solutions) == 0:
    print("No solutions found.")
else:
    solution = solutions[0]
    solavble = True

    # Storing the solution in 2d array
    for i in range(1, 10):
        for j in range(1, 10):
            sudoku_solv[i - 1][j - 1] = (solution[i * 10 + j])
Solved Sudoku
Thank you
Thank you for reading my article. Feel free to reach out to me if you have any questions. Check out the code at Sudoku_AI
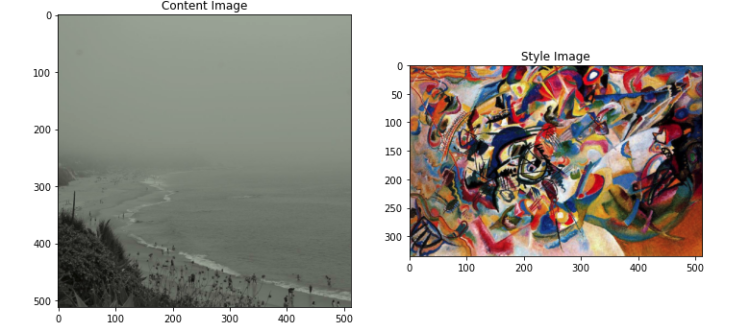
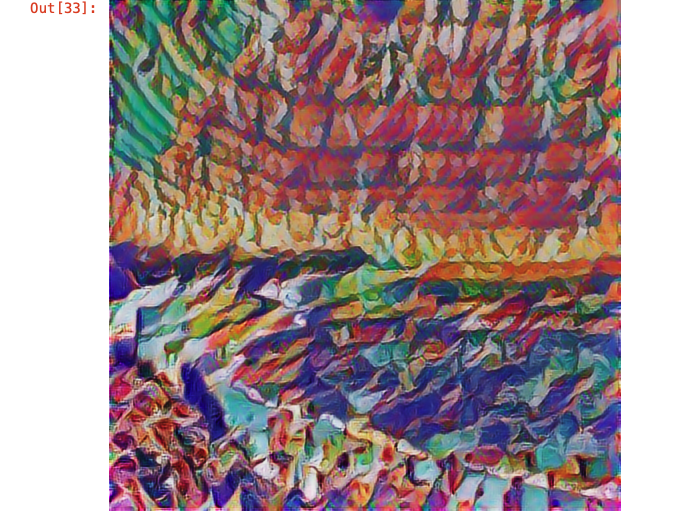
Neural style transfer is an optimization technique used to take two images — a content image and a style reference image (such as an artwork by a famous painter) — and blend them together so the output image looks like the content image, but “painted” in the style of the style reference image.
Let’s begin with the setup.
Import modules.
import tensorflow as tf
import IPython.display as display

import matplotlib.pyplot as plt
import matplotlib as mpl
mpl.rcParams['figure.figsize'] = (12,12)
mpl.rcParams['axes.grid'] = False

import numpy as np
import PIL.Image
import time
import functools
The article shows an approach to solving problem of selecting best technique in machine learning. This can be done in R using just one library called AI-JACK and the article shows how to use this tool.
Perhaps it’s time to take a look at this relatively new offering from Stanford, Ethical and Social Issues in Natural Language Processing (CS384), an advanced seminar course covering ethical and social issues in NLP.
Listen to this on-demand webinar and hear how WorldQuant Predictive derives insights from building models on sensitive data while maximizing value and minimizing risk.


