Read this second entry in a series on time series analysis and seasonality, and see how, through 2 simple use cases, the power of a seasonality index is uncovered.
Originally from KDnuggets https://ift.tt/2K6pd9z

365 Data Science is an online educational career website that offers the incredible opportunity to find your way into the data science world no matter your previous knowledge and experience.
Originally from KDnuggets https://ift.tt/2K6pd9z
Originally from KDnuggets https://ift.tt/2RAfT1F
Originally from KDnuggets https://ift.tt/34vVlNj
After given the project of building and comparing a Support Vector Machine machine learning model with the multilayer perceptron machine learning model, I was interested in comparing the two models in-depth. The dataset that the project was using was a Wisconsin Breast Cancer Dataset, where there were two classifications my machines were supposed to predict. It would predict if a patient(each row in dataset) had a benign or malignant cancer type based on the various details we had on that patient. A really powerful real world example in my opinion. Let’s dig further into the process →
[The rest of the article will follow along the project documentation where the actual code is present. If you find yourself interested as I refer to the code, you can view the actual python notebook here]
After importing needed packages for the purposes of this project, I initially break the Data up into a feature vector and label vector. The label vector is where I will perform the predictions and the feature vector is the data that I will use to predict a classification. Furthermore, I will break up the initial vectors into Training sets for the feature and label vectors and Testing sets for the feature and label vectors as well.

Standardization is important when building a machine learning model as it creates a Gaussian, or normal, distribution of the data in the feature vectors so that the predictor model can learn from all of the data, even if extreme, effectively. We accomplish this process using Sci Kit Learn’s StandardScaler() function. This process also consists of regularizing the data to prevent overfitting, which basically is an event that occurs when the model performs perfectly on a specific set of data but does extremely poorly when tested on new data.

Jobs in ML
What is Linear Separability?
Linear Separability refers to checking if one can completely separate classification of data in an n-dimensional space using N — 1 dimensions. For example, if classification of data is plotted on a single line, if the classes can be separated by a single point it is linearly separable. Another example is if you can separate classification data by a straight line on a 2-D plot.
Our Learning Curve
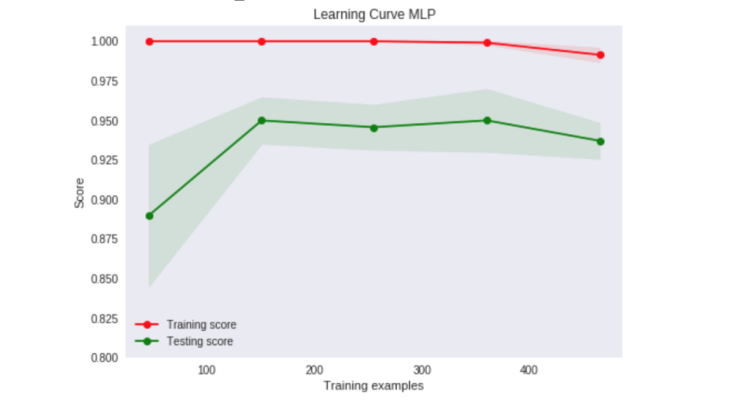
From looking at this specific learning curve, the perceptron does not converge and so we can determine that the data in this case is not linearly separable, and with that knowledge, we know that we should use at least one hidden layer in our model.
We start building our support vector machine by establishing a svm under the variable vectorMachine with a linear kernel function. We will use a linear function as our SVM will predict on a 2-dimensional space, as our input vector contains one dimensional data.
1. Part-of-Speech tagging tutorial with the Keras Deep Learning library
2. Tutorial: Stereo 3D reconstruction with openCV using an iPhone camera
What is a kernel function?
This is a key attribute of the SVM model as it is a mathematical function that transforms data into higher dimensional space so that the machine can perform faster calculations (i.e. like creating vectors that serve as boundaries for specific classifications in data).

How does a support vector machine work?
After the kernel function has been applied to our data and we have an appropriate n-dimensional space, the support vector machine finds an optimal hyperplane, or separating line, between the classifications, but as close to the nearest classification as possible. After the machine has determined the hyperplane it classifies the data, by quickly configuring if incoming data is on either side of the hyperplane.
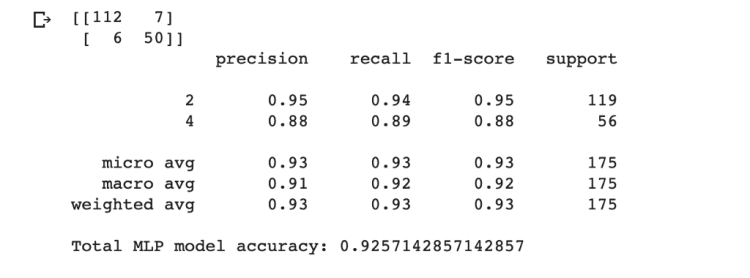
Next, we fit (train) the machine with a function that operates on our testing sets. After the SVM is fitted and ready for new data, we use the predict() function provided by Sci-Kit Learn and create a vector of predictions on the prime testing set of the Wisconsin Breast Cancer data. And just like the Multilayer Perceptron model above, we can determine model accuracy by dividing the sum of correct predictions the SVM makes by the length of the label vector, y_test.

Although, it’s close, the SVM model generally is getting better results!
By default, SVM’s usually have higher prediction accuracy than a multilayer perceptron. SVM’s might have higher runtime as there are calculations it performs that are advanced like translating n-dimensional space using kernel functions. But it usually does a very good job in its predictions.
In this dataset, we are classifying breast cancer outcomes by various attributes that are observed with each patient. The two classifications our models are predicting are either benign or malignant. This data specifically is prime for an SVM model, as it can easily find the perfect hyperplane after translating the data using its kernel function.
The purpose of this is to cross validate the accuracies the SVM model has on K different versions of the dataset. In this case 5 different versions.
How I think of cross-validation techniques
I like to envision 5-fold cross validations as almost like a balance beam visual, where one side is the training portion and the other side is the testing portion of the data, and we have 5 equal weights dispersed across the balance beam. We start with 1 on testing side and 4 on the training side and then we take from training to testing with K iterations training our model. So eventually every combination will be tried and it is quite thorough in determining model accuracy.
Following the code:

I found this experiment very conclusive! It performed pretty much how it was supposed to:
As always, thanks for reading! I learned a lot more about the differences between the two models as I was documenting this project so I hope you learned a bit too.


Comparing SVM and MLP Machine Learning Models was originally published in Becoming Human: Artificial Intelligence Magazine on Medium, where people are continuing the conversation by highlighting and responding to this story.

At the Barbican Center in London, on October 31st, 2018, London Contemporary Orchestra will play two great pieces of contemporary classical music by Giacinto Scelsi and John Luther Adams. However, there is something new and unique about this event. In unprecedented step, the music will be accompanied by visuals that are automatically generated using an artificial intelligence algorithm in response to live music with aesthetics inspired by nature.
Displaying visuals to accompany music in concerts is typical in live pop-music concerts, and sometimes in classical music concerts too. However, such visuals are typically prepared offline and scripted to play along the music and mostly are not reactive to the music. Making such visuals usually requires lengthy work by computer graphics and animation experts using various software tools and elaborate effort to give the illusion that the visuals are synchronized with the music. In offline scenarios, when making a music video or a movie, art directors and computer animation and graphic designers have the time to generate visuals that synchronize with music, however this is such an intricate and time-demanding process. The 1940 Disney movie Fantasia was groundbreaking in that front, where around 1000 artists and technicians worked in making it.
What is happening at the Barbican event is quite different. The visual art is generated by an artificial intelligence algorithm in real-time in response to live music as it is played. The algorithm generates images with aesthetics from nature and uses the music as inspiration for the generation.

At Artrendex we developed Music2Art, a generative model that takes music as inspiration to make art. The algorithm uses a novel generative model that learn the aesthetics from a collection of images or videos offline. At the concert, in real-time, the algorithm takes the music stream, decomposes it to basic frequencies and align the audio frequency contents with a representation of the aesthetics that it learned offline. The generative model then renders new images that is directly reactive and synchronized with the music.
We first experimented Music2Art with AICAN art. AICAN uses Creative Adversarial Network to learn the aesthetics by looking at art from art history and generate art that follows that aesthetics but doesn’t fit existing styles. Music2Art aligns the music content with the modes of variations in the generated art. In this example we used the 5th movement from Giacinto Scelsi, Uaxuctum. We only chose the first frame for the visual.
In another example, we tried a very fast music the Sabre Dance from Khachaturian Gayaneh ballet, the results was very colorful and dazzling.
For the concert with London Contemporary Orchestra, in Collaboration with the Universal Assembly Unit, we trained the system with nature-inspired visuals including videos of volcanos, thunder storms, caves, underwater, and others. The algorithm learns the aesthetics from these sources and use that in its generation. The results is very captivative chromatic visual experience.
1. Part-of-Speech tagging tutorial with the Keras Deep Learning library
2. Tutorial: Stereo 3D reconstruction with openCV using an iPhone camera
This is a trial where we used aesthetics from a cave for the 5th movement of Giacinto Scelsi, Uaxuctum
In another trial, we used underwater aesthetics to accompany John Luther Adams Become Ocean
At the concert, several other visuals will be used. It is exciting to see what will happen at the concert. We have little control over the generation in real-time. The process were only tested in studio setting with recorded music, never in a concert hall with a live full size orchestra. We cannot predict what will be generated. Anything can go wrong. We hope everything will go right.
At the concert two great pieces of contemporary classical music will be played. The first is by Italian composer Giacinto Scelsi, titled “Uaxuctum: The Legend of the Maya City, destroyed by the Maya people themselves for religious reasons”. “it’s a work so demanding that this is the first time it has been heard in the UK, even though it was written over 50 years ago” said Huw Humphreys, the Head of Music at the Barbican Center. The second is by American composer John Luther Adams titled “Become Ocean” which musically depicts the world consumed by seas. Alex Ross, the New Yorker music critic described it as “may be the loveliest apocalypse in musical history.”
The AI generated visual element complements the music to give the audience an enchanted multi-sensory experience in a concert titled “Other Worlds.”
Project Credits:
The algorithm is developed by Artrendex Inc, a NY-based startup that builds innovative AI for the creative domain. Art direction is done by London-based Universal Assembly Unit. The development of the project has been the result of over six months of research and development aided by Devin Gharakhanian, Benjamin Heim and Simon Hendry. The concert will be performed by London Contemporary Orchestra and Choir, conducted by Robert Ames.
Music2Art: Automatic Generation of AI Imagery Reacting to Music was originally published in Becoming Human: Artificial Intelligence Magazine on Medium, where people are continuing the conversation by highlighting and responding to this story.
Differential geometry is a mathematical discipline that uses tools of calculus and algebra to study problems in geometry. Sounds daunting? Yeah, same. So this series of articles is an attempt to break it down into simpler questions and even simpler answers because I myself am not from a purely mathematical background which made it difficult for me to learn and implement this intuitively for my current research (https://ozamanan.github.io).
Coming back to differential geometry. It has applications in physics, chemistry biology, computer-aided graphical design, computer vision, image processing, machine learning and much more. I will be focusing on this from the point of view of machine learning and its applications in machine learning.
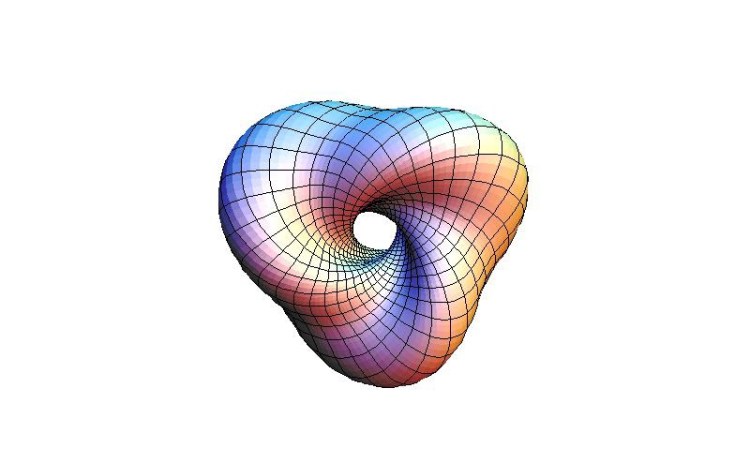
I am going to spare you most of the mathematics for this this article. So what is a manifold? That is a bigger question. Imagine being a point on a straight or curved line. How would you be moving in your “line-world”? Either forward or backward, isn’t it? What if you were a point on a plane? You would be moving in any direction but still be a part of the plane. You can keep adding dimensions and your degrees of freedom would keep increasing and your “world” would be a manifold of a some topological space. (I’ll be talking bout topology as well but in later articles).

That was a layman’s explanation to what a manifold means. The next property of a manifold is that it is a euclidean space and is homeomorphic.
1. Part-of-Speech tagging tutorial with the Keras Deep Learning library
2. Tutorial: Stereo 3D reconstruction with openCV using an iPhone camera
Now homeomorphism is that property of a space wherein you can continuously modify it (change its shape geometrically) and get a new shape. If you have been able to do this then the initial structure and the new one are said to be homeomorphic.

Now, Riemannian manifolds are smooth manifolds equipped with the Riemannian metric that is defined as the shortest length (geodesic) from one point to another along the curve (manifold). Well, That is the simplest I could make it without using math. 🙂
Machine learning is highly dependent on some or the other kind of data. This data is usually high dimensional and training models in so many dimensions comes with its own set of challenges pertaining to the training, accuracy, etc. This is where computational geometric learning (CGL) or manifold learning (a concept in CGL) steps in. Manifold learning is nothing but nonlinear dimensionality reduction to train the models in lower dimensions which improves training time, accuracy and learns the data distribution more accurately. [1]
Now for obvious reasons we would want our training process to be as short as possible and data manifolds to be accurate, therefore we use Riemannian manifolds for their geodesic property. Now this may sound like incomplete knowledge and I agree that it is. But to understand the new questions that arise due to my above claim there is a lot of reading and math to get into. I will cover that in the future articles. I am giving links to a few references that I went through to understand this concept and think further.
What are Riemannian Manifolds and why do we care? (Part 1) was originally published in Becoming Human: Artificial Intelligence Magazine on Medium, where people are continuing the conversation by highlighting and responding to this story.
Originally from KDnuggets https://ift.tt/34ENuwY
Originally from KDnuggets https://ift.tt/2VnD5kZ
Originally from KDnuggets https://ift.tt/3b3mjOM
Originally from KDnuggets https://ift.tt/2wtJxhO
source https://365datascience.weebly.com/the-best-data-science-blog-2020/knime-spring-summit-online-edition
