365 Data Science is an online educational career website that offers the incredible opportunity to find your way into the data science world no matter your previous knowledge and experience.
We all are aware of AI and all the amazing things it is capable of. We have seen how it has helped us solve the most complex problems like they were no big thing and become more productive by reducing human error.
However, AI also brings along the challenges of data privacy and security. In one way or another, we are trading our personal information for comfort.
Sure, we are safeguarded by encryption. But somehow, we are so much invested that even encryption is taking a backseat.
Hence, VPN companies are taking it upon themselves to ensure business protection. Some of them are even using AI to enhance their capabilities.
This often leads me to wonder what AI has in store for the VPN industry. How is it going to impact us? Will VPNs stay relevant in the future when the world will be dominated by artificial intelligence or it will somehow get lost somewhere?
That is why I am here for this blog in which we will discuss how AI is going to impact the VPN industry. Let us begin:
Big Data Jobs
AI Censorship is Real
Let us face it. Governments and big companies are using AI to detect, censor, and ban content.
Sometimes, it is for the good of people. Some countries are using AI to block websites and applications that are a threat from the security point of view. Facebook, Instagram, and Twitter are using AI to censor content that promotes hate, biasedness, or terrorism. Even YouTube uses AI to detect videos that promote terrorism. In September 2017 alone, it took over 83% of such videos.
However, there are times when AI can also be abused in censoring content. You must be aware of the Great Firewall of China. This collection of legislative actions, technologies, and AI helps the Chinese government domestically regulate the internet. Some other governments are doing the same to ban content they feel is hurting their cultural and religious sentiments.
In fact, it is not just China, many countries are even using AI as a means to prevent brands from showing content outside their geo-license allowed locations. If you are worried that Netflix and Amazon Prime are not showing your favorite TV series or movie, it is probably because they do not have the rights to display that content in your country.
So, the problem of AI censor is very much real and there is little you can do about it.
However, the heart wants what it wants. Even if your favorite movie or TV series is not available in your country, you may still want to watch it.
Now, the question is: how?
Well, VPNs are providing a great way for bypassing AI censorship and Geo-restrictions. According to 2020 stats, over 26% of all 4.1bn internet users are using VPN services to access restricted video content, stay anonymous on the web, or access services that are not available in the country. No wonder VPN is one of the most flourishing industries at this moment and it will continue to grow in the future.
How are Governments and Brands Combatting this?
Governments and Brands are using anti-VPN software to deal with people who are using VPN to access geo-restricted or AI-censored content. These anti-VPN software use AI to track and flag IP addresses that are using VPNs to bypass Geo-restrictions and censorship.
So, unless you are using a powerful VPN that is using IP addresses that are still not flagged by the anti-VPN software or are powerful enough to beat the AI, you are in tough luck. Chances are that your access will be immediately blocked the moment you try accessing restricted content on Netflix or Amazon Prime.
Using VPNs to access content that is censored by the government can even land you in legal trouble. So, it is important to be careful.
As a result, there is a demand for VPN systems that are powerful and can even bypass anti-VPN software.
This quest has brought a new revolution in the VPN industry. VPN has become so powerful that now they are using the power of AI to go around internet censorships. Netflix geo-restriction is no longer a big issue because we have the best VPNs for Netflix using which you can enjoy a seamless and sensor-free binge-watch experience.
Not only this, but there are also VPNs for accessing restricted content or tools that are unavailable in your country. All you need is someone who keeps a close eye on these things.
Where Security Lies in All This?
You may somehow feel that among our quest to rely on VPNs to go around restrictions and AI censorship, security has taken a backseat. But that is not the case. VPNs always take security seriously.
Even over time, VPNs have improved a lot from the security point of view with artificial intelligence. With the power of machine learning, VPNs can combat various security threats more efficiently. They can now better protect users from cyber-attacks.
Machine learning and VPN have also brought corporate data security to a whole new level. Even during the COVID-19 time, many organizations relied on VPNs to ensure smooth remote working. In fact, it was the only reason why IT enterprises were able to work from home without any hassle.
Artificial intelligence has also helped VPNs deal with the issue of slow internet with the help of a technique called AI-based based routing. Using this technique, VPN software can route users to the server that is closest to their location thus experiencing better speed and optimized ping response. The technique also ensures that the VPN traffic stays within the network and users cannot be tracked easily.
In simple words, AI is making VPNs more efficient and secure by adding a new layer of protection.
In a Nutshell
I believe VPNs are definitely going to be around in the future. With the increasing reliance on artificial intelligence, we need them around.
Sure, AI is changing lives, but it is also a subject to abuse. VPNs can keep such things in check. They can also ensure security which often gets ignored in our increasing quest for comfort.
The best thing is VPNs are actually benefiting from artificial intelligence and machine learning. They are now becoming more powerful and efficient. It will only make them more popular and their demand will increase.
In short, we are not far from days when we can browse the web without any fear of censorship, geo-restrictions, or even cyber threats.
Anyways, what do you think about the impact of artificial intelligence on the VPN industry? Please share your thoughts in the comments.
No Bias Labeled Data — the New Bottleneck in Machine Learning
The Performance of an AI System Depends More on the Training Data Than the Code
Over the last few years, there has been a burst of excitement for AI-based applications through businesses, governments, and the academic community. For example, computer vision and natural language processing (NLP) where output values are high-dimensional and high-variance. In these areas, machine learning techniques are highly helpful.
Indeed, AI depends more on the training data than the code. “The current generations of AI are what we call machine learning (ML) — in the sense that we’re not just programming computers, but we’re training and teaching them with data,” said Michael Chui, Mckinsey global institute partner in a podcast speech.
AI feeds heavily on data. Andrew Ng, former AI head of Google and Baidu, states data is the rocket fuel needed to power the ML rocket ship. Andrew also mentions that companies and organizations which are taking AI seriously are eager to acquire the correct and useful data. Moreover, as the number of parameters and the complexity of problems increases, the need for high-quality data at scale grows exponentially.
Data Ranks the Second-Highest Obstacle in AI Adoption
An Alegion survey reports that nearly 8 out of 10 enterprises currently engaged in AI and ML projects have stalled. The research also reveals that 81% of the respondents admit the process of training AI with data is more difficult than they expected before.
It is not a unique case. According to a 2019 report by O’Reilly, the issue of data ranks the second-highest obstacle in AI adoption. Gartner predicted that 85% of AI projects will deliver erroneous outcomes due to bias in labeled data, algorithms, the R&D team’s management, etc.
Big Data Jobs
The data limitations in machine learning include but not limited to:
Data Collection: Issues such as inaccurate data, insufficient representatives, biased views, loopholes, and data ambiguity affect ML’s decision and precision. Especially during Covid-19, certain data has not been available for some AI enterprises.
Data Quality: Since most machine learning algorithms use supervised approaches, ML engineers need consistent, reliable data in order to create, validate, and maintain production for high-performing machine learning models. Low-quality labeled data can actually backfire twice: during the training model building process and future decision-making.
Efficiency: In the process of machine learning project development, 25% of the time is used for data annotation. Only 5% of the time is spent on training algorithms. The reasons for spending a lot of time on data labeling are as follows:
The algorithm engineer needs to go through repeated tests to determine which label data is more suitable for the training algorithm.
Training a model needs tens of thousands or even millions of training data, which takes a lot of time. For example, an in-house team composed of 10 labelers and 3 QA inspectors can complete around 10,000 automatic driving lane image labeling in 8 days.
Dealing with complex tasks, the task is automatically transformed into tiny component to make the quality as high as possible as well as maintain consistency.
All work results are completely screened and inspected by the machine and the human workforce.
Efficiency
The real-time QA and QC are integrated into the labeling workflow.
ByteBridge takes full advantage of the platform’s consensus mechanism which greatly improves the data labeling efficiency and gets a large amount of accurate data labeled in a short time.
Consensus — Assign the same task to several workers, and the correct answer is the one that comes back from the majority output.
Ease of use
The easy-to-integrate API enables the continuous feeding of high-quality data into a new application system.
End
“We have streamlined data collection and labeling process to relieve machine learning engineers from data preparation. The vision behind ByteBridge is to enable engineers to focus on their ML projects and get the value out of data,” said Brian Cheong, CEO of ByteBridge.
Both the quality and quantity of data matters for the success of AI outcome. Designed to power AI and ML industry, ByteBridge promises to usher in a new era for data labeling and collection, and accelerates the advent of the smart AI future.
During the study of Data Science, I met a batch of new algorithms and libraries useful for data analysis and predictions. All of them have their cons and pros. It is not a surprise. But only one algorithm has a reputation as lazy and greedy from the first word. You can put in this definition some different variants. Also, we can debate about the laziest algorithm! But today, I talk about the k-nearest neighbors’ algorithm, where symbol k means the number of nearest neighbors. A lot of blogs started from weaknesses and forgot about the advantages.
KNN is an effective classification and regression algorithm that uses nearby points to generate a prediction.
Why do we call KNN lazy?
KNN model does not need any training data points for model generation. That means it doesn’t learn a discriminative function from the training data but rather memorizes all training data instead. It makes training faster and brings a real problem — memory and time greedy for the testing phase.
Why does it happen with KNN?
The KNN algorithm assumes that similar things exist close, similar things are near to each other.
If you are similar to your neighbors, then you are one of them.
All of the training data must be present in memory to calculate the closest K neighbors.
Sometimes the cost of the calculating distance between the new point and each existing point becomes higher.
Big Data Jobs
Is KNN has something good?
We can start from data because this algorithm has no assumptions about data.
It is easy to understand, so it is a simple algorithm.
We can use it for classification and regression (For regression — when the output variable takes continuous values. For classification — when the output variable takes class labels.)
Usually, this algorithm has high accuracy (relatively).
KNN one of the most popular algorithm for text categorization or text mining.
KNN can help in forecasting in agriculture when we need to predict climate. Also, it can use for estimating soil water parameters. Evaluate forest inventories and for estimating forest variables.
Finance. For example, when we collect financial characteristics vs. comparing people with similar finance features to a database. We can use this information to: predict credit rating, manage loans, bank customer profiling, money laundering analyses, etc.
Medicine. Algorithms based on clinical and demographic variables can identify the risk factors for cancer, predict hospitalization due to a heart attack, etc. Or we can estimate the amount of glucose in the blood of a diabetic person from the infrared absorption spectrum of that person’s blood. (Hello, new apple watch!)
And it is only a few examples that I can remember from real life. The KNN algorithm is a robust and versatile classifier that simple to use and easy to understand.
Summary
In this blog, I do not give you any hard definitions and formulas, just my thought about one algorithm and its reputation. Thank you for reading!
EDA is a fundamental early process for any Data Science investigation. Typical approaches for visualization and exploration are powerful, but can be cumbersome for getting to the heart of your data. Now, you can get to know your data much faster with only a few lines of code… and it might even be fun!
Research shows that people skills are becoming more important with the rise of AI. A great way to boost these skills is by reading the new book: People Skills for Analytical Thinkers.
This tutorial discusses the confusion matrix, and how the precision, recall and accuracy are calculated, and how they relate to evaluating deep learning models.
“Data Scientist(n.): Person who is better at statistics than any software engineer and better at software engineering than any statistician.” –Josh Wills, Director of Data Engineering at Slack
We stand in midst of a deluge of data today. Starting from the smartphone in your palm to the smart refrigerator at your home, it’s everywhere. Today, over 2.5 quintillion bytes of data is generated every day, which is expected to rise up to 463 exabytes by 2025. Even though the systems that generate these vast volumes of data expire in a matter of time, the data doesn’t. And that’s how we arrive at data science, the art of discovering insights and knowledge concealed in the data.
Big Data Jobs
The Essentials
So, you’re finally all buckled up for this phenomenal journey that will encompass through vastly different worlds of science and engineering. But don’t worry, all the prerequisite essentials you need is the will and patience to learn new things.
A little bit of mathematical foundation in linear algebra, statistics, and calculus would save you valuable time in the journey but even if you don’t have any knowledge about them, you’re still eligible to start on this road and are expected to learn them as and when required.
The first step towards becoming a good data scientist is to have a fair amount of knowledge and experience with the programming language you’d be using for data science. Although any programming language can be used for data science such as Java, Python, JavaScript, Julia, R, Scala, SQL, and many more, these days we tend to use either Python programming language or R programming language.
That is because there are a lot of packages for data science that are readily available for both of these programming languages. Additionally, Python being a general-purpose programming language with a simple syntax offers a lucrative starting point for beginners. The rest of this article goes about a Pythonic way to learn Data Science since this will supposedly be your choice of learning as well.
There’s no absolute need to master all of Python, given it is a general-purpose programming language and is suited to do a number of things. But you should be focusing more on the in-built data structures of Python such as list, dictionary, tuple, string, and their different methods, and so on. Some other concepts that will enable you to write object-oriented code such as classes shall also be practiced. Practicing general coding exercises that cover these topics and getting ample practice is essential to be good at programming.
By now, you should’ve had a fair understanding of how python works, and in general how simple python programming syntax is. But all this simplicity comes at a cost: behind the scenes, it’s the huge chunks of C programming language code that makes python so flexible. This, in turn, makes python one of the slowest programming languages as compared to C/C++, Java, etc.
In data science, you’ll be dealing with array data structure a lot more than any other data structure. But Python list data structure, although flexible, is too slow to process the humongous amount of data we’d process in machine learning. That’s where Numpy comes to the rescue. Numpy is a package for the Python programming language which is solely there to ease the process of array creation and manipulation.
This is one of those fundamental packages that you’d use in your every machine learning project, due to obvious reasons such as it accelerates the speed of the array operations by integrating C code under the hood, it allows only homogenous data type unlike the Python list data structure and it fragments a given operation for its parallel execution to speed up the process.
You’re expected to have a decent knowledge about the basic concepts such as Numpy array creation and manipulation; the different array operations such as reshaping, broadcasting, adding, or removing dimensions, etc. While you’re at it, you’d also be able to learn the various array methods defined in Numpy such as calculating mean, standard deviation, max and min element, and so on.
When working with volumes and volumes of data, it’s more than often not easy to make sense out of it by directly looking at it. That’s why we opt for data visualization for a visually appealing, graphical representation of the data and its various aspects.
Data visualization in Python is mainly performed using two packages, Matplotlib and Seaborn. Both of these libraries offer a plethora of charts and graphs which can be used to understand and convey various aspects of data, such as histograms, scatter plots, box plots, violin plots, cat plots, and so on.
You’d be exploring these plots while experimenting and understanding the application of each one of them. Once satisfied, you’re all set to dive deep into the world of statistics.
Karl Pearson, the man attributed as the father of modern statistics once quoted…
“Statistics is the grammar of Science”
Particularly in data science, statistics holds a paramount relevance because it is the key to understanding and unlocking the secrets withheld in the data. Although being too vast in its existence, you’d like to begin with understanding the implications of fundamental concepts such as mean, standard deviation, variance, covariance, correlation, etc.
Next up, you’d like to learn about the different types of probability distribution functions that govern the behavior of the data which follows that type of distribution, the most important of which is the Gaussian distribution, also known as the Normal distribution. You’d also learn about the usefulness of standard normal distribution and how the central limit theorem can be advantageous.
Another aspect of statistics and probability that you’d be using a lot in data science is inferential statistics, which is primarily used to draw inferences by observing the data. This includes concepts such as hypothesis testing, p-value, confidence intervals, the margin of error, and so on. Although much of the statistical basis required for data science comes pre-packaged in the libraries and packages we use these days, it’s still important to learn these concepts to be able to understand data science at a fundamental level.
Although the concepts mentioned here only encompass a very small portion of the actual amount of statistics that goes in data science, you can work these out to get a fundamental understanding of how statistics shall be used in data science. Later on, you’d again reunite with statistics while dealing with the specifics of the machine learning algorithms.
In machine learning, you’d mostly be dealing with either structured data or unstructured data. Structured data follows a tabular representation and hence it is important to be able to create and manipulate the tabular data. Pandas library is solely intended for this purpose. It helps with the creation of “data frame” objects that can be easily visualized and understood.
Pandas is by far the most widely used tool by data scientists because it is the standard choice for assisting with exploratory data analysis and data cleaning, which are two very essential parts of almost every data science project. There are many fundamental operations in pandas for data frame manipulation that need to be mastered.
Exploratory data analysis concerns picking out relevant observations from the data by different means of its analysis, including statistical and graphical methods. You’re expected to learn about how to pick out these observations from any given dataset. A good practice is to write your observations in the comments to refer to them later and understand the course of decisions made.
Finally, we’re all set to start with the machine learning algorithms to solve the datasets. Mastering these algorithms from a very fundamental level is an outright necessity to be a good data scientist, which includes gaining insights into the mathematical aspects of these algorithms. Although the implementation of these algorithms will be readily available to you within the libraries and packages such as scikit-learn, it’s still of paramount importance to understand them fully.
Alongside these algorithms, you’d also learn different techniques employed to make the learning part more suitable so as to increase the model performance, such as the concept of outliers, the concept of scaling the dataset, how hyperparameters i.e. the parameters of the model which cannot be learned during the training phase are tuned, the notion of “curse of dimensionality”, calculation of feature importance and statistical techniques for feature selection.
On a high level, machine learning algorithms can be classified into two categories: supervised learning algorithms and unsupervised learning algorithms. Supervised learning algorithms are used to learn a decision mapping from the independent variables (also known as features) to the dependent variable (also known as the target). These are further classified into regression algorithms, where the target variable is continuous and classification algorithms, where the target variable is categorical.
There are many fundamental supervised learning algorithms that you’d be learning such as linear regression, k-nearest neighbors, support vector machines, linear discriminant analysis, logistic regression, naive-bayes, and so on. Once done with these, you’d learn about tree-based algorithms such as decision trees.
A category of tree-based algorithms is ensemble algorithms, which use multiple decision trees (each of which is called a weak learner) to solve the same problem and then combine their results to produce the final outcome. Ensemble algorithms are majorly categorized as bagging, boosting, and stacking. Several popular algorithms such as random forest, gradient boosted decision tree, adaptive boosting, light gradient boosting, extreme gradient boosting are to be studied under the ensemble algorithms.
Unsupervised learning algorithms are those, which don’t have any specific target variable to which we map our independent variables. Unsupervised learning algorithms can be grouped into two categories, namely clustering algorithms and associative algorithms. Some of the algorithms you’d learn under unsupervised learning algorithms are k-means clustering, DBSCAN clustering, principal component analysis for dimensionality reduction, and so on. There are several applications of unsupervised learning algorithms such as anomaly detection, clustering, dimensionality reduction, to name a few.
After preparing the data and training the machine learning model, the evaluation of trained machine learning models is an absolute necessity in order to ascertain its performance and reliability. It should be noted that the methods used for the evaluation of machine learning models are case sensitive i.e. different types of metrics are used for different purposes. As an example, accuracy might not be a good metric to evaluate the applications of AI in medicine, rather we tend to check the sensitivity and specificity of the model to decide its performance.
A common practice to ensure a fair evaluation of the machine learning models is to divide the dataset into train and test splits so that the model can be trained on the train set while the test set can be used for validation. Failing to do so will result in what is known as “data leakage”, where the data which is to be used for the evaluation of the model has already been used to train the model. This causes the model to produce over-optimistic evaluation results, which don’t depict its actual performance.
Another way to validate the credibility of the model is by cross-validating it for the entire dataset. K-fold cross-validation is when we divide the entire dataset into K subsets and then iterate for each of the K subsets so that a particular subset acts as the test set while the rest of the subsets combinedly act as the train set. Later, the metrics from each of the trained model is averaged to report a final metric.
There are also a number of metrics that you’d learn such as accuracy, precision, recall, F1 score, receiver operating characteristics area under the curve. You’d be learning about the confusion matrix and evaluation of models trained on a class imbalance dataset and how to use dummy classifiers and regressors for the purpose of evaluation.
Deep learning is a subset of machine learning where artificial neural networks, inspired by the behavior of neurons in the human brain, are used to learn very complex decision functions. Neural networks can be described as a collection of interconnected “neurons” in a layered fashion, where individual neurons are nothing but a mathematical function.
The only precursor to using deep learning is the availability of a large amount of data. Deep learning can be used for supervised learning as well as unsupervised learning. It finds its applications in a number of places such as virtual assistants, self-driving cars, face recognition to name a few.
In order to implement neural networks, some of the most popular libraries and frameworks are Keras, Tensorflow, and Pytorch. These libraries and frameworks implement deep learning models using very few lines of code. Apart from these, you’d certainly be learning three types of artificial neural networks which are multilayer perceptrons, convolutional neural networks, and recurrent neural networks.
These three types of neural networks form the basis of more complex neural networks and thus they need to be studied at a fundamental level. You’d also be learning about the different activation functions, the different ways in which we can tune the hyperparameters of the network, how the different optimizers work, how to use memory-efficient batch learning to handle huge datasets during the training, and many more techniques to implement deep learning.
One of the most underrated aspects of machine learning is perhaps the deployment of the trained models. Deployment of machine learning models refers to the process of interfacing and integrating a trained machine learning model in order to expose it to the end-user or application as a service.
The term also extends to the concept of incremental learning, where a machine learning model keeps updating its knowledge-base with the help of all the input data it receives. It allows the creation of machine learning models that can be trained on infinite data streams, which are much more scalable as it can actively adapt to the data as and when it comes.
There are multiple cloud-based deployment platforms where one can deploy their machine learning models. Some of the most popular IaaS cloud deployment options include Amazon AWS, Microsoft Azure, Google Cloud Platform, and so on. PaaS cloud services such as Heroku, PythonAnywhere also enable the deployment of machine learning models.
Conclusion
Everything you read so far is only a very small fraction of all that is there to know in data science, yet these topics constitute the very foundation of it. That being said, data science is a domain that is still being explored and researched very actively, and there are so many questions in data science and AI which are yet to be answered.
Let’s face it, even before we were properly exposed to data science we had probably heard both of these terms: overfitting and underfitting. The reason these two terms shall be regarded as the guiding philosophy of machine learning is that every machine learning model in existence conforms to the trade-off between both of these, which in turn dictates their performance and therefore every machine learning algorithm seeks to create models that offer the best trade-off between them.
But why do we care about it?
Whenever we model any data using machine learning, the end objective is that the trained model should be able to correctly predict the output label when a previously unseen set of inputs is provided to it. So how does the model achieve this? It does so by learning a decision mapping or simply a function from the set of inputs to the output label during the training process.
Therefore, the validity and performance of our model can only be realized when it is evaluated using previously unseen data. So how can we say if a model will give good predictions for previously unseen data or not? It depends on the ‘generalizability’ of the model i.e. if the decision mapping learned by the model during the training remains valid for the previously unseen data as well so that it produces correct predictions for them, the model can be regarded as generalizable.
Big Data Jobs
As we would learn, both overfitting and underfitting are hindrances towards a model’s generalizability; a perfectly generalized model wouldn’t suffer from any overfitting or underfitting. Although in reality, it’s impossible to achieve a perfectly generalized model with no overfitting and underfitting. Instead, we rely on a trade-off between them where we strive to reduce both of them to a point where we achieve a ‘best fit’, the maximum possible generalizability for a model.
What is a model?
Before understanding overfitting and underfitting, we must understand what a model is. In the realm of statistics and data science,
A model can be understood as an abstract representation of the real world which is created only using the data that we are provided, which is otherwise called a ‘sample’.
As an analogy, if we want to make a generic model of a tangible physical classroom, then each physical aspect of the classroom such as the no. of benches, the no. of desks, the dimensions of the whiteboard, etc., is the information or the data associated with it which we can use to model it.
A model can also be thought of as a mathematical function that maps a set of inputs to an output. This set of inputs and the output are different ‘aspects’ of our model and through machine learning, we attempt to establish a relationship between the set of inputs and the output. As an example, given the number of benches and desks in a classroom, we can easily establish a relationship that will compute the number of students who can attend the class simultaneously.
The Notion of Overfit, Good fit, and Underfit [source]
So how does this notion extend to the idea of overfitting and underfitting? Let’s consider a scenario where a student needs a tailor-made school uniform. For this purpose, the tailor needs some information about the student’s physique first, so that the uniform will fit the student properly. But there’s a catch, although the tailor is extremely skillful and can take very accurate measurements of the student’s physique and tailor the dress perfectly as per that data, the type of fabric used by the tailor is found to have shrunk by some amount when washed. Due to this, there’s always a degree of uncertainty regarding how well the dress will fit the student since the amount of shrinkage can’t be predetermined.
So how can the tailor accommodate this uncertainty while tailoring the uniform so that it still fits the student? If the tailor decides to make the uniform very loosely fit as compared to the measurements, then even after shrinking the uniform will loosely fit or ‘underfit’ the student. If the tailor decides to make the uniform absolutely as per the measurements, then the uniform is bound to be tightly fit or ‘overfit’ the student after shrinking. So what’s the solution? The tailor shall leave only a judicious amount of margin for shrinkage while tailoring the uniform so that even after washing it offers a perfect fit or ‘best fit’ for the student.
Understanding Overfitting and Underfitting With Regression Models
Let us perform a simple experiment. To understand the notion of underfitting and overfitting, we will try to fit a few regression models to a set of data points. Our very first step will be to import a few Python libraries to enable us to fit the regression models and plot them:
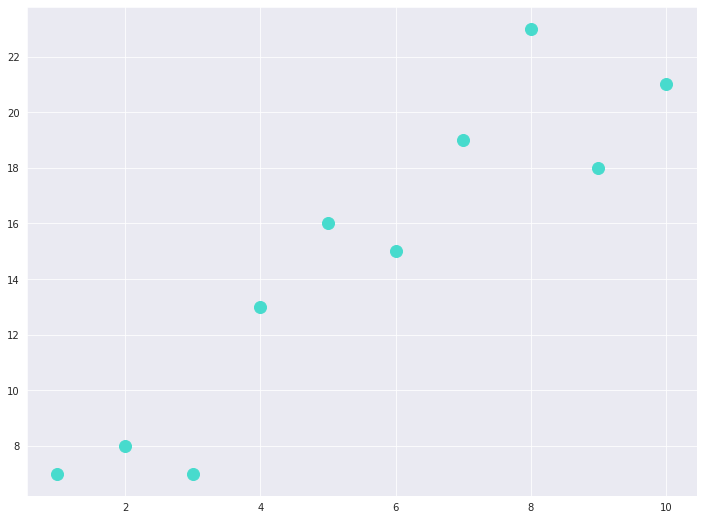
Let us get ourselves some sample data points to fit the model upon:
Here’s how they appear in a scatterplot:
Scatter plot of 10 data points in a 2D plane
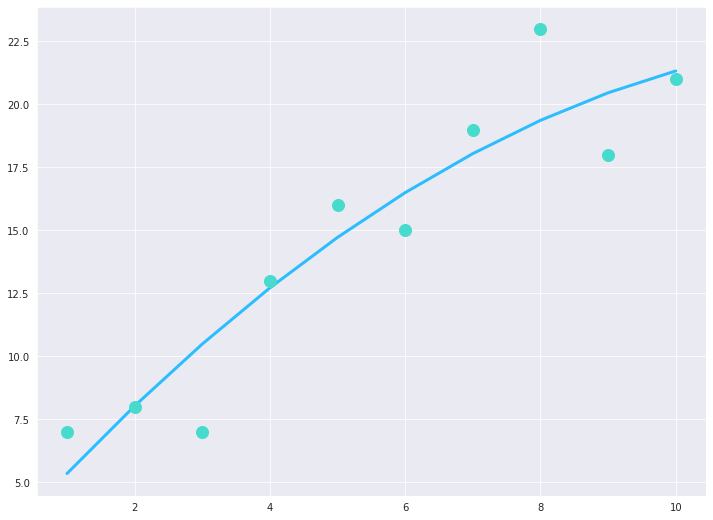
We will, first of all, fit a basic linear regression line to these data points and calculate the regression formula, represented by ‘a’ here, using the fit model’s coefficients and y-intercept. Thereafter, we plot the regression line along with the data points:
Upon executing the above piece of code we obtain the following result:
Linear Regression Model fitting the 10 data points
A basic linear regression line like the one shown above seems to model our data points just alright, but we can see it doesn’t do a very good job of capturing the overall trend; we obtain an r-squared score of 0.85. But can we do better? Let’s try to fit a polynomial regression line of degree 2 and plot it:
The above piece of code generates the following plot:
Polynomial Regression Model of degree 2 fitting the 10 data points
This time we obtain an r-squared score of 0.87. Although we don’t have a major improvement in the score, now it appears that upon increasing the degree of the polynomial, the r-squared score is increasing and the overall trend of the data is getting captured more accurately. Thus, one may argue that we should keep increasing the degree of the polynomial as it is improving the score. We’ll try to find out what happens then. Let’s try to fit a polynomial regression line of degree 9 and plot it:
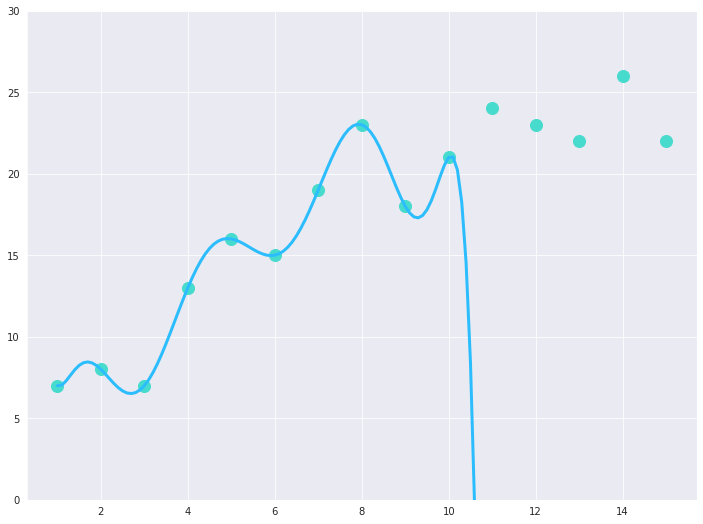
Polynomial Regression Model of degree 9 fitting the 10 data points
Our model produces an r-squared score of 0.99 this time! That appears to be an astoundingly good regression model with such an impressive score. Or is it the case?
As we read earlier that the goodness of any model is determined by its generalizability. So to determine how generalized this model is, let’s add five additional observations to our synthetic dataset which supposedly belong to the same distribution as the original data sample. It is worth noting that the model hasn’t been trained on these data points. Here’s how the model behaves for the newly added data points:
Polynomial Regression Model of degree 9 being tested for 5 additional data points
So what just happened? We had obtained the best r-squared score for the polynomial regression line of degree 9 earlier, yet it failed to model any of these new points, and we have received a negative r-squared score this time, which indicates it is an extremely inefficient model. Thus, it can be concluded that it is not a generalized model; although it performs supremely in an attempt to model the training data, it is unable to model any new data point which it hasn’t been trained on. Thus, this model can be regarded as an overfitting model or a high variance model.
Overfitting
According to Wikipedia, overfitting refers to
“the production of an analysis that corresponds too closely or exactly to a particular set of data, and may therefore fail to fit additional data or predict future observations reliably.”
As evident in our experiment, the polynomial regression model with degree 9 conformed the training data to such an extent that it lost its capability to generalize or in other words, the model picked up the random fluctuations in the overall trend i.e. the noise in the data. Hence, the model was unable to predict the previously unseen points correctly as it hasn’t learned the general trend from the data but only picked up the noise. This particular situation is regarded as overfitting.
In this particular case, the model kept coming up with complex and even complex decision rules with the objective of modeling all the training data points perfectly. But in this process, it totally disregards the notion of generalizing, and hence, those decision rules fail to model the unseen data points.
Now one may come up with the intuition that complex decision rules always lead to overfitting and hence one shall stick to the simplest possible decision rules with the hope that it will help the model generalize very well. But is it the case? Let’s find out.
We will try to model the same five additional observations using the linear regression model this time and by logic, they should be mapped extremely well as the model should be more generalized this time. But instead, this happens:
Linear Regression Model being tested for 5 additional data points
We obtain an r-squared score of 0.65 this time and as evident, the new data points still haven’t been modeled correctly by the linear regression model, and instead of an improvement in the performance, it has degraded by some amount. Thus, this model can be regarded as an underfitting model or a highly biased model.
Underfitting
According to Wikipedia,
Underfitting occurs when a statistical model ormachine learningalgorithm cannot adequately capture the underlying structure of the data.
As evident in our experiment as well, linear regression was never able to model the data correctly, it didn’t fit the training data well and it also failed to model the unseen data.
Usually, the model is found to be underfitting when there’s not enough training data for the model to learn from or when the model itself is unable to capture the trend from the data due to its underlying nature.
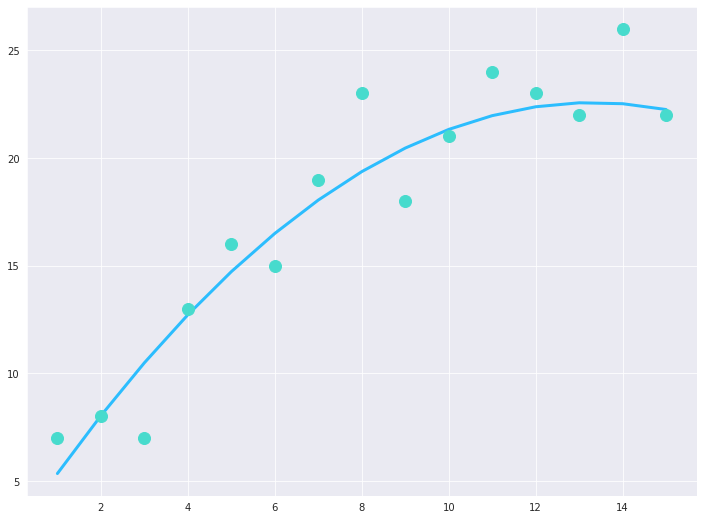
So what is the solution then? The only possible solution to this dilemma is that we meet somewhere in between where the model neither overfits nor underfits and we have a model that has a “good fit”. If we try to model our five unseen data points using the polynomial regression model of degree 2, we obtain the following result:
Polynomial Regression Model of degree 2 being tested for 5 additional data points
We obtain an r-squared score of 0.90! This time the model is able to correctly predict and model the overall trend of the data, which is confirmed by the increase in the r-squared score after the addition of the five unseen data points.
The decision mapping learned by this particular model is generalized enough so that it can map the data points that it hasn’t been trained upon as well.
Conclusion
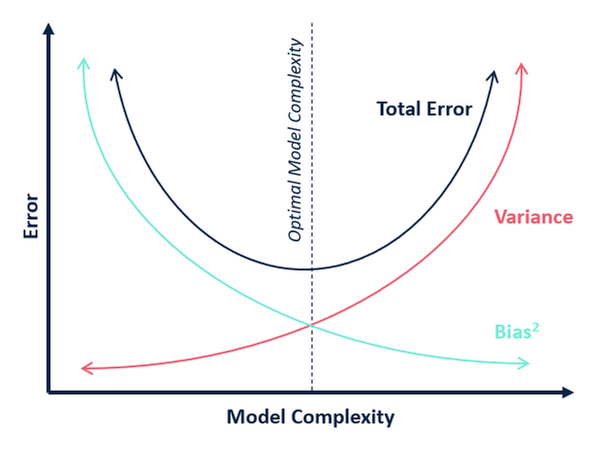
Bias-Variance Tradeoff Curve
Overfitting and underfitting are two governing forces that dictate every aspect of a machine learning model. Although there’s no silver bullet to evade them and directly achieve a good bias-variance tradeoff, we are continually evolving and adapting our machine learning techniques on the data-level as well as algorithmic-level so that we can develop models that will be less prone to overfitting and underfitting.


