365 Data Science is an online educational career website that offers the incredible opportunity to find your way into the data science world no matter your previous knowledge and experience.
There’s a clear inclination towards the MLaaS model across industries, given the fact that companies today have an option to select from a wide range of solutions that can cater to diverse business needs. Here is a look at 3 of the top ML platforms for data excellence.
Today’s engineers need to be equipped with the tools to take on leadership positions across industries. The new master’s program at the University of Chicago’s Pritzker School of Molecular Engineering will provide you with a streamlined and flexible degree to give you broad exposure across science and engineering disciplines, while preparing you for the immediate next step in your professional journey.
Predicting the impact of the White Swan event is not an easy job. Applying supervised machine learning techniques and collecting inputs from open resources, I aim to analyze the influencing indicators to the unemployment rate in Australia and forecast the unemployment rate in 1Q2021 as a result of Covid-19.
Machine learning(supervised) techniques: Time-series forecasting techniques and regression
Quarterly Wages & Salaries by State (cat.no.5676.0″ — table20 ; Australia Bureau of Statistics)
Agenda:
Part 1. Exploratory analysis: data cleaning & understanding characteristics of the dataset
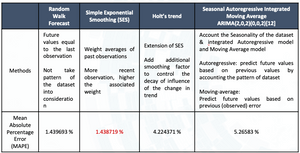
Part 2. Time-series forecast: Random Walk, Simple Exponential Smoothing, Holt’trend, and ARIMA (Autoregressive Integrated Moving Average)
Part 3. Study the influencing factors by using machine learning technique: Multiple Linear Regression
Big Data Jobs
Part 1. Exploratory analysis: data cleaning & understanding characteristics of thedataset
The Crisp-dm (cross-industry standard process for data mining) methodology is used to explore and conduct the analysis (Graph 1). The business understanding will be reviewed to provide a big picture before pre-processing data by conducting the exploratory analysis, forming the analysis direction, and selecting the appropriate datasets to study.
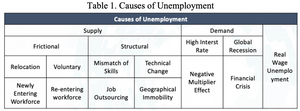
To begin with, the understanding of labour market theory is reviewed to define the analysis’s direction. There are thirteen causes that influence unemployment, categorizing into (1) causes by supply sides, (2) causes by demand sides, and (3) causes by real-wage unemployment (Table 1). Frictional is defined as the time people take to move between jobs; structural is defined as the mismatch of skills, and real-wage unemployment is defined as demand for labour falls as firms have less incentive to employ workers at a higher wage rate.
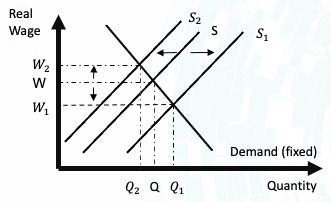
First, for the causes by the supply side, there are two scenarios, including (1) the increasing of labour supply, and (2) the decreasing of labour supply. In the first scenario, the hypothesis is that number of people not in the labour market was increased dramatically as a result of the pandemic. For instance, the students, who live in Australia eligible to get jobs domestically but did not want to search for the jobs as they can rely on their family subsidies, decided to seek out jobs, helping their family to overcome the recession. Then, line S would be shifted to S1 (Graph 2), moving the LS to LS1 at a faster speed than the shifting of the WS line (from WS to WS1) (Graph 3). As a result, the unemployment rate would be increased (U < U1) (Graph 3). In the second scenario, the hypothesis is that number of people not in labour market was decreased significantly as a result of the lockdown. The potential explanation is that the number of fresh graduates/workers left the labour force by a great amount and/or the number of deaths was exceeding expectation. The phenomenon caused a significant decrease in supply, moving S to S2, LS to LS2, and WS to WS2. In addition, the WS2 was moved at a faster speed than LS2 as the choice of enterprises on qualified candidates was narrowed.
Graph 2 & 3: Impacts of Supply Side To Unemployment
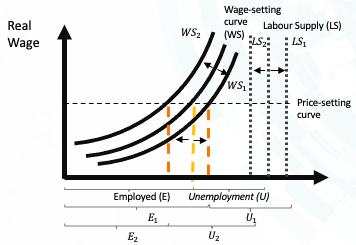
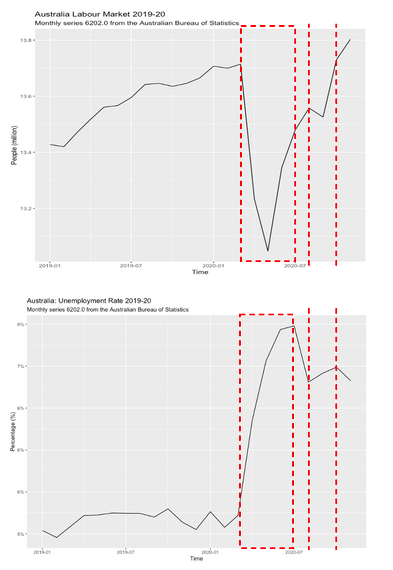
Graph 4 & 5: Australia Labour Market 2019–20
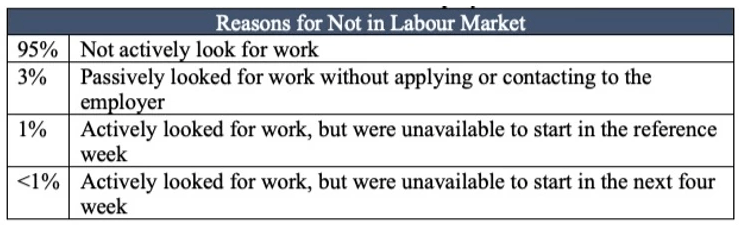
Then, the historical data of the Australian labour market 2019–20 was explored to confirm the above hypotheses. From Graph 4 & 5, the population aged 15 years and over in 2018–20 was not be affected much. However, the AU labour force was dropped dramatically while the unemployment rate rose rocket. Hence, the latter case occurred. As there are two potential sub-cases in the second hypothesis, the data of not in labour market 2018–20 and the population aged 15 years and over 2018–20 were evaluated, exploring the insight. According to Table 2, the main reason for not joining the labour force is that people did not actively look for work, and the heavily shifting upward trend of the line was also caused by the 82% increasing in that category (Australian Bureau of Statistics. 2020). Hence, the clock down has affected Australian sentiment and job search demand.
Table 2: Reasons for Not In Labour Market
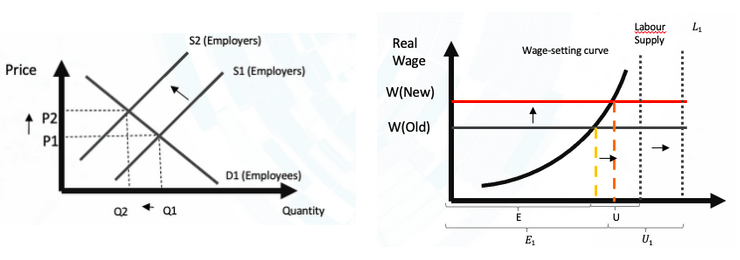
Second, for the causes by real-wage unemployment, the possibility that the decision to increase 1.75% wage implemented in July 2020 (Fair Work Ombudsman, 2020) impacted the unemployment rate. In the normal condition, the lifting of the wage-setting curve can positively assist the labour market by shifting E to E1 and U to U1. However, there would be the case that some companies could not bear the new wage-setting, leading to shifting of quantity from Q1 to Q2, shifting labour supply line towards L1, and moving U to U1 (Graph 6, and 7, respectively). As this order will be fully effective in February 2021, and there will be a certain delay for the cause by real-wage unemployment, more data need to be collected and explored in the later stage.
Graph 6 & 7: Real-Wage Unemployment
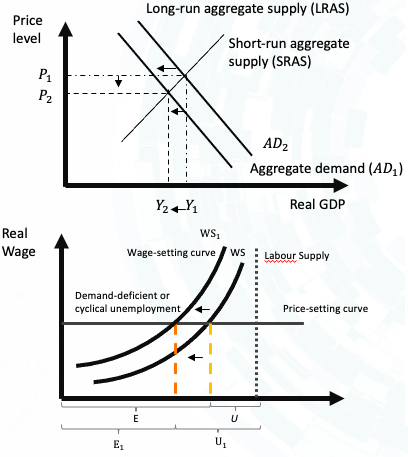
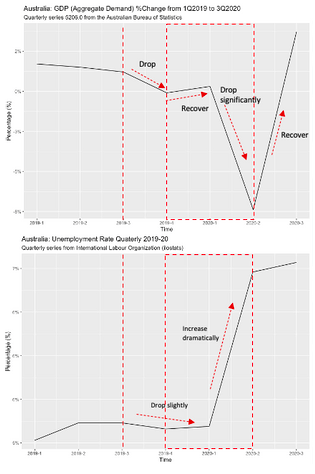
Lastly, for the causes by the demand side, when the long-run aggregate supply line (LRAS) was shifted backward, the wage-setting curve was affected, shifting it to the left, and the demand-deficient issue is recorded (Graph 8 & 9). According to Graph 10 & 11, there is clear evidence that demand-deficient unemployment would be the case.
Graph 8 & 9: Impacts of Demand Side To UnemploymentGraph 10 & 11: Historical data 2019–20
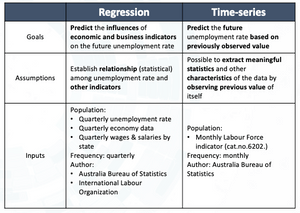
In summary, three scenarios have been reviewed to provide an overview of potentially related elements for choosing and analyzing. For the forecasting, time-series analysis and regression analysis are techniques chosen to conduct the predictive analysis.
Table 3: Applied Supervised Learning Techniques
Part 2. Time-series forecast: Random Walk, Simple Exponential Smoothing, Holt’trend, and ARIMA (Autoregressive Integrated Moving Average)
Time-series forecasting:
or
predictive value = intercept + lagged values + lagged error
It is necessary to evaluate whether the dataset is white-noise to conduct the upcoming step. The White-noise criteria include (1) the mean equals 0, (2) the standard deviation is constant, and (3) the correlation between lag is 0.
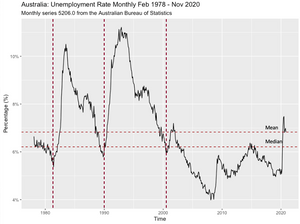
Graph 12: Monthly Unemployment Rate in Australia Feb 1978 — Nov 2020
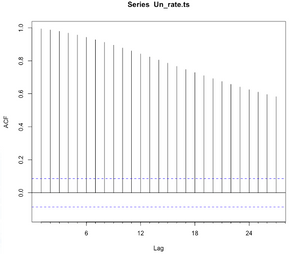
First, from Graph 12, the mean of the dataset was not equal. Besides, the standard deviation of the dataset was not constant. The “acf” function from the forecast package in R was used to test the correlation between lag and recorded not-equal-0 result (Graph 13). Notice that as the used autocorrelation function is obtained from forecast package instead of stats package, the lag showed in the horizontal axes show lags in time units (monthly) rather than seasonal units.
Graph 13: Autocorrelation Test
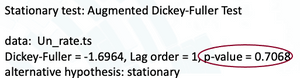
Furthermore, the Augmented Dickey-Fuller Test was conducted to review whether the dataset is stationary. The obtained result indicates that the time-series is not stationary (Graph 14). Details information about the null hypothesis testing can be found in the github file. The first difference transformation process is applied to treat the dataset as stationary for autoregression integrated moving average (Arima) analysis in the later stage.
Graph 14: Augmented Dickey-Fuller Test
Then, the dataset was split into train & test dataset. Train dataset is contained data collected from February 1978 to June 2020, and the test dataset is contained data collected from July 2020 to November 2020. Four models were implemented for forecasting, including (1) Random Walk Forecast, (2) Simple Exponential Smoothing (SES), (3) Holt’s trend, and (4) Seasonal Autoregressive Integrated Moving Average — SARIMA(2,0,2)(0,0,2)(12). The (2) model was out-perform others with a mean absolute percentage error (MAPE) equal to 1.438719% (Table 4). Details explanation about the model building methods can be found in the github file.
The four-month prediction was conducted and the results were plotted on Graph 15. White the Holt’s trend method provides that the unemployment rate will be increased continuously, the SARIMA(2,0,2)(0,0,2)(12) model illustrates that the unemployment rate could be decreased, reaching 6.8% in March 2021 (Table 5).
Graph 15: Forecast Monthly Unemployment Rate Dec 2020 — Mar 2021 & Table 5: Forecast in details
Part 3. Study the influencing factors by using machine learning technique: Multiple Linear Regression
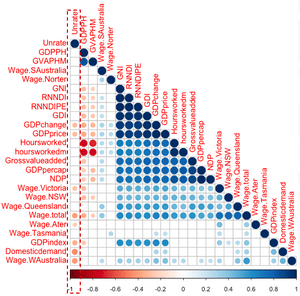
Graph 16: Correlation Plot
From Graph 16, the variables that have strong statistical relationship with unemployment rate are GDPchange, GDPprice, Wage.Victoria, Wage.total, Wage.alter, GDPindex, Domesticdemand, Wage.WAustralia. However, there would be a certain level of multicollinearity. Hence, the multicollinearity was diagnosed by using vif function from car package in R. Criteria to select variables and building model include (1) p-value < 0.05, (2) VIF < 10, and (3) R-squared >= 0.3. According to Moore, Notz, and Flinger (2013), r-square lower than 0.3 indicates a none or very weak effect size, and, according to James (2014), VIF value above 5 or 10 should be removed from the model.
The dataset was split into train & test dataset with the ratio 80:20, and details information related to the hypothesis testing, variables selection process, and though process can be found on the github’s file.
Prediction model:
Quarterly Unemployment Rate (%) = 6.16691 + (-0.92121) * [Domestic final demand: Index - Percentage change] + (-0.17724) * [Wages quarterly percentage change ; Total (State); Total (Industry)]
Standard deviation of residuals: 0.7092026
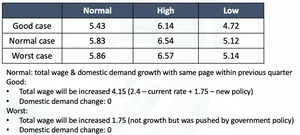
Three cases are created to forecast the unemployment in 1Q2021 with the assumption stated in table 6.
Table 6: Predictive Results & Assumptions
The shortage of this regression model is that r-squared (0.3794) is lower than 0.5. R-squared can be improved when keep adding new variables. To ensure that the added variables are useful, adjusted R-squared should also be considered when evaluating the model’s performance. The decision to use quarterly datasets from different resources was made due to the shortage of data. Therefore, it is also a risk that the data collection, pre-processing, and terminology definition might be different between inputs. Consequently, potential optimization methods are: (1) collect real-time data & adding real-time data in a shorter period such as monthly instead of quarterly, and (2) increase the complexity by including variables such as the government expense on Job Keeper package and other supporting attempts to recover the economy.
References:
Australian Bureau of Statistics. 2020. Reasons people are not in the labour force. [online] Available at: <https://ift.tt/3aC9k7G> [Accessed 3 February 2021].
Fair Work Ombudsman. 2020. Welcome to the Fair Work Ombudsman website. [online] Available at: <https://ift.tt/3jl6sQu> [Accessed 3 February 2021].
James, Gareth, Daniela Witten, Trevor Hastie, and Robert Tibshirani, 2014. An Introduction to Statistical Learning: With Applications in R
Moore, D.S., Notz, W.I, & Flinger, M.A, 2013. The basic practice of statistics (6th ed.). New York, NY: W.H. Freeman and Company. Page 138
The Data Scientist professional has emerged as a true interdisciplinary role that spans a variety of skills, theoretical and practical. For the core, day-to-day activities, many critical requirements that enable the delivery of real business value reach well outside the realm of machine learning, and should be mastered by those aspiring to the field.
Are your customers turning cold towards your products and services? Are they choosing your competitors over you? Is it getting difficult for you to meet their growing demands? If your answer to all these questions is a yes, it might be time to overhaul your customer experience strategy.
The consumers of this digital era look for a seamless, customized user experience in whatever solution or product they use. To meet their changing needs, businesses need to upgrade their tactics with the latest technologies and business models. Emerging technologies such as Artificial Intelligence and Machine Learning have tremendous potential to manage customer interaction and improve customer engagement.
Read on to find out how AI can enhance customer experience and how you can use it effectively for your business.
Big Data Jobs
The Role of AI in Customer Experience
Managing customer experience involves dealing with a mammoth amount of data about who your customers are and how they relate to your business. AI can leverage this data and the insights generated from it to drive customer experience strategy. It automates the mundane and repetitive tasks of data structuring, cleansing, and maintenance, and gives meaningful insights which help companies to craft more targeted and personalized customer experiences.
Here are some noteworthy ways in which you can use AI to improve customer engagement and experience.
A customer’s online activity and daily interactions with your business generate enormous data, that needs to be mined and structured to derive relevant insights. AI allows you to collect relevant and useful data from all possible channels and use them in the right manner to deliver efficient customer service. It also records data from service requests, customer feedback, customer interactions, customer trends, etc., and helps you put them to efficient use to improve customer experience.
Better customer service with chatbots and virtual assistants
AI can transform customer service by making it automated, seamless, and fast. Chatbots work as a substitute to call centre executives and salespeople manually interacting with the customers. They simulate human interactions and provide relevant and personalized responses to their queries immediately. This reduces delays and minimizes errors in customer service.
Improved Personalization
With customers coming across data and information at all times in the digital world, it is necessary to cut through the noise. Delivering personalized experiences is an integral part of your customer experience strategy. AI uses data to delve deeper into customer insights such as their purchase patterns and online behavior. It then matches the data with your business context and helps you determine the most appropriate action or messaging to shape the customer experience.
Conclusion
With its evolution and technological advancements over time, AI opens doors to endless opportunities that enhance customer engagement and create significant customer experiences.
At Gateway Digital, we leverage the power of AI to digitally transform your business and help you provide exceptional value to your customers. We offer a range of AI-ML-based intelligent, intuitive, and automated products and solutions that help in enriching customer experiences.
We need to upgrade to stay relevant in the industry otherwise will be obsoleted
AI is an area of computer science that emphasizes on the creation of intelligent machines just like humans, which can work and react just like us. They are much more accurate and precise in their work. These bots are more efficient than human in some specific domains and are growing smarter with each passing day. They can do some really tough tasks which are considered difficult for any human being.
The results associated with the Artificial intelligence are promising & lucrative. But as every invention is associated with some demerits, so is the artificial intelligence. It can do many things like Programming, Reasoning, and Problem-solving, Learning or Planning like human do. But there are still a few areas for which a human is required. Machines are learning very fast and machine learning algorithms have accelerated the pace.
A machine can work efficiently only it has abundant data and information about the work which is being imparted daily to them. But with every forward step & advancement in the technology, a threat is proliferating, a threat of being replaced on our work front. Every passing day is sealing some jobs for humans all over the globe.
Big Data Jobs
When there were no artificial intelligence, no machines, a lot of humans were working. People were engaged in a lot of operations and jobs. It took time and money and speed too was sluggish. But now machines are working as peers with humans and are eating away newer jobs by proving as a worthy employee. They are passing tests every day and overcoming the issues of fatigue and speed which were always there with humans.
Rising competition has fueled the demand to cut expenses. Reducing the workforce is today a preferred alternative for many manufacturing companies all over the world. These job cuts have created panic in the job markets. There are many jobs which are at greater risk of evaporation, a few of them are as under.
Sports Umpires: -. With a total population of 7.6 billion, there are 1.6 billion or approximately 9.8% of the total world population are engaged in the non-playing roles. These people are associated with the games and will be soon replaced.
An approximate figure of about 1.6 million, only in UK and USA, will be soon replenished by the bots. In sports, decisions at some crucial points are very difficult for an umpire. Sometimes, as the prestige of a team is totally dependent on the result of an umpire. Introducing bots can be a wiser option. It provides us more accurate result in less time but on the other hand, it eats up someone job.
Workers and floor operators in any manufacturing unit:– They are the people who are highly susceptible to being replaced by these smart bots. Manufacturing units are now inclined towards technology for the skilled workforce who can work day and night without fatigue and can deliver any task without asking for any facility.
The machines can work day and night 24*7 without any break or leave and can manage everything efficiently. Day by day low skilled workers are being replaced by this phenomenon and are rejected by their employers.
Farm Labors: — With the advancement of new technology, farming has transformed totally. Machines are being preferred for various farm activities and these machines can work really fast. At the time of harvesting, speed is crucial and bots have an upper hand again.
Telemarketers:– Now Machines are trying their hand in the field of telemarketing too. These machines record the call data about the customer’s need without any miss and also handles their queries effectively similar to humans. Most people have similar questions so bots can easily handle and answer. Sometimes when it’s tricky, the baton is passed to a human.
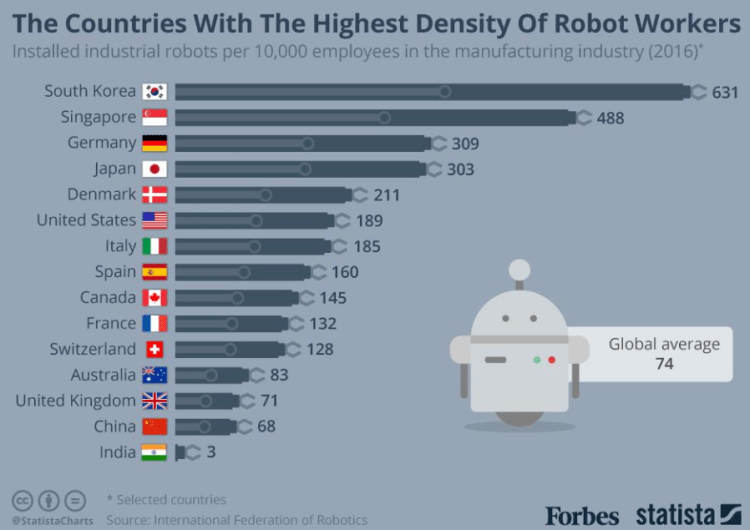
courtesy: Statista
There is a greater threat to the people who stand at the bottom of skill pyramid. With the low skill set people’s job is highly risked and are greatly hit by the technology. Some low skilled jobs like Foreman, Draughtsman, Farmer, Security guard, Taxi driver and many more jobs are at the bottom of this skill pyramid.
It is not all even other moderately skilled people are also carrying a fear inside as soon they will be at the bottom. About 40%-50% people from the world’s working population are moderately immune. Here are some of the profiles which are at lower risks. Recommended Post: Artificial Intelligence- advances and impact
Taxi-drivers: — These jobs are comparatively skilled and thus are at moderate risk. There are many companies now, working on developing a self-driven car. These cars are much more efficient and intelligent but it will take a lot more time to be a reality on the roads. It fails in those areas which are more crowded and populated, there we need a smart human driver who can respond to the situation with lightening speed.
Bakers: — Now many different types of intelligent machine are in the market which can bake food. Only we have to add the ingredients and fill the information about what you want to cook and within a few seconds, we get our desired food or drinks. Conventionally, baking is not something which needs a high level of skill, it’s just the right proportions of ingredients which can be arranged manually by a human being and the rest is left for the machine. AI has fulfilled that requisites of basic intelligence in the machines.
Fisherman: — With the introduction of bots in the fishing industry the very existence of fishermen is under the scanner. The technology has reduced the human risks of fishing in a turbulent ocean and bots are doing the work of catching fish in those days. But still, in many countries fishing is generally practiced manually which sooner or later will be taken over by the bots.
It is not that all of the human race will be unemployed after introducing the bots in industry. There are some professions which need higher skills and response time, better analytical skills and most important a personal human touch. Such jobs are immune to this job eradication. A few such profession can be firefighters, photographers, and physicians. There are lot many jobs which are still handled by humans and using a bot for these works is still a distant dream.
With a survey, report says that many big companies are now turning to this technology. They are replacing their low skilled employees and creating large-scale unemployment. It is not very easy for all of the people to accept this technology as it causes mass unemployment and job insecurity. Every person in this world has a unique skill by birth that can’t be ignored. Moreover, one can’t easily change his/her profession if he/she has gained experience in that particular profession after working for so many years.
“AI powered systems and automation technology could be humanity’s greatest existential threat.”
About 35% of the workforce is getting unemployed in the UK and 49% workforce in Japan alone. Almost 48% of employees in the USA are at high risk of losing their jobs because of this automation and artificial intelligence. Humans need to evolve faster than the machines to avoid their chances of being replaced. But sadly, technology is changing rapidly and the fate is inevitable.
The Best Data Science Project to Have in Your Portfolio; Deep learning doesn’t need to be a black box; Build Your First Data Science Application; How to create stunning visualizations using python from scratch; How to Get Your First Job in Data Science without Any Work Experience