365 Data Science is an online educational career website that offers the incredible opportunity to find your way into the data science world no matter your previous knowledge and experience.
In this second article in this series, we’ll continue to take an interview-driven approach by linking some of the most commonly asked interview questions to different components of A/B testing, including selecting ideas for testing, designing A/B tests, evaluating test results, and making ship or no ship decisions.
Google’s recently launched Data Analytics Professional Certificate on Coursera is great for anyone, regardless of background or experience. The program is completely online, self-paced, and costs $39 per month. Interested in preparing for a new career in a high-growth field?
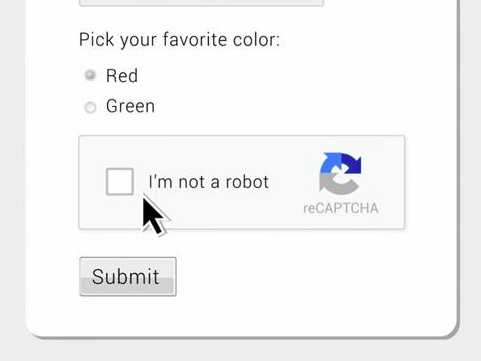
Living in the Internet age, how occasionally have you come across the tricky CAPTCHA tests while entering a password or filling a form to prove that you’re fully human? For example, typing the letters and numbers of a warped image, rotating objects to certain angles, or moving puzzle pieces into position.
What is CAPTCHA and How Does It Work?
CAPTCHA is also known as the Completely Automated Public Turing Test to filter out the overwhelming armies of spambots. Researchers at Carnegie Mellon University developed CAPTCHA in the early 2000s. Initially, the program displayed some garbled, warped, or distorted text that a computer could not read, only a human can. Users were requested to type the text in a box before having access to the websites.
The program has achieved wild success. CAPTCHA has grown into a common part of the internet user experience. Websites need CAPTCHAs to prevent the “bots” of spammers and other computer underworld types. “Anybody can write a program to sign up for millions of accounts, and the idea was to prevent that,” said Luis von Ahn, a pioneer of the early CAPTCHA team and founder of Google’s reCAPTCHA, one of the biggest CAPTCHA services. The little puzzles run on because computers are not as good as humans at reading distorted text. Google says that people are solving 200 million CAPTCHAs a day.
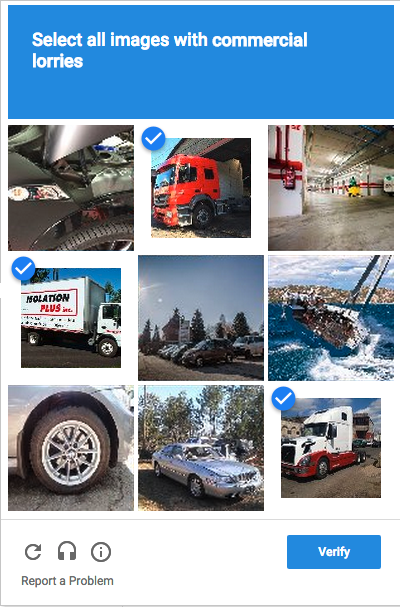
Over the past years, Google’s reCAPTCHA button saying “I’m not a robot” was up in more complicated scenarios, such as selecting all the traffic lights, crosswalks, and buses in an image grid.
Big Data Jobs
CAPTCHA’s Potential Influence on AI
While used mostly for security reasons, CAPTCHAs also serve as a benchmark task for artificial intelligence technologies. According to CAPTCHA: using hard AI problems for security by Ahn, Blum, and Langford, “any program that has high success over a captcha can be used to solve a hard, unsolved Artificial Intelligence (AI) problem. CAPTCHAs can be used in many places.”
reCAPTCHA is a CAPTCHA system developed by Google, which is a system that allows web hosts to distinguish between human and automated access to websites. The original version asked users to decipher hard to read text or match images.
Since 2011, reCAPTCHA has digitized the entire Google Books archive and 13million articles from New York Times catalog, dating back to 1851. This done, reCAPTCHA started to select snippets from Google Street View in 2012. the company made users recognize door numbers, signs, and symbols.
The warped characters that users identify and fill in for reCaptcha are for a bigger purpose, as users have unknowingly transcribed texts for Google. reCAPTCHA distribute the same content to dozen users across the world and automatically verifies if it has been transcribed correctly by comparing the results.
Clicks on the blurry images can also help identify objects that computing systems fail to manage, and users are actually sorting and clarifying images to train Google’s AI engine.
In 2014, the system started training the Artificial Intelligence (AI) engines.
Through such mechanisms, Google has been able to get users involved in recognizing images process, in order to give better Google search and Google Maps results.
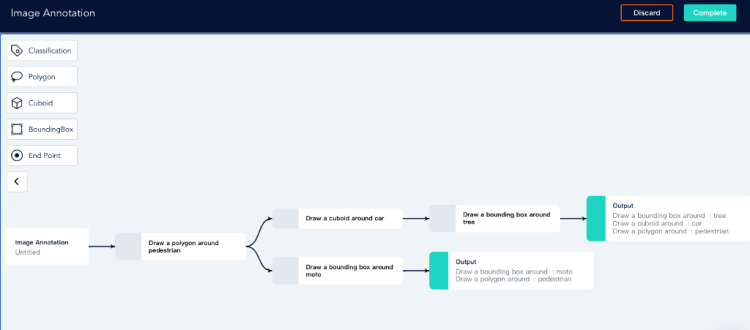
ByteBridge: a Human-Powered Data Annotation Platform to Empower AI
Turing Award winner Yann LeCun once expressed that developers need labeled data to train AI models and more quality-labeled data brings more accurate AI systems from the perspective of business and technology.
ByteBridge is a human-powered data labeling tooling platform with real-time workflow management, providing flexible data training services for the machine learning industry.
Flexibility
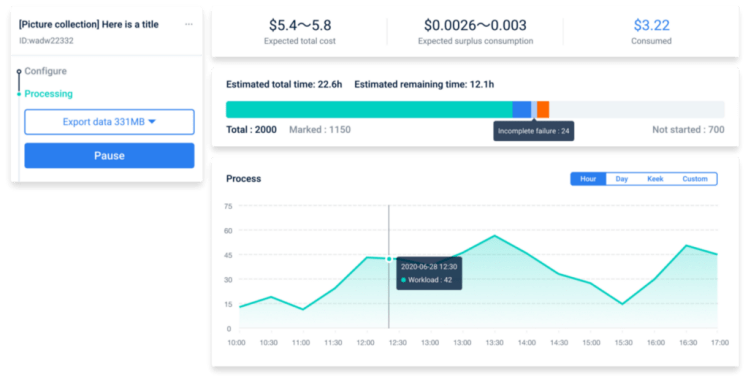
On ByteBridge’s dashboard, developers can create the project by themselves, check the ongoing process simultaneously on a pay-per-task model with a clear estimated time and price.
Precisely, developers can decide when to start your projects and get your results back instantly
Clients can set labeling rules directly on the dashboard. (No need to communicate with a project manager about labeling guideline)
ByteBridge: a Human-powered Data Labeling SAAS Platform
Clients can iterate data features, attributes, and workflow, scale up or down, make changes based on what they are learning about the model’s performance in each step of test and validation
Progress preview: clients can monitor the labeling progress in real-time on the dashboard
Result preview: clients can get the results in real-time on the dashboard
ByteBridge: a Human-powered Data Labeling SAAS Platform
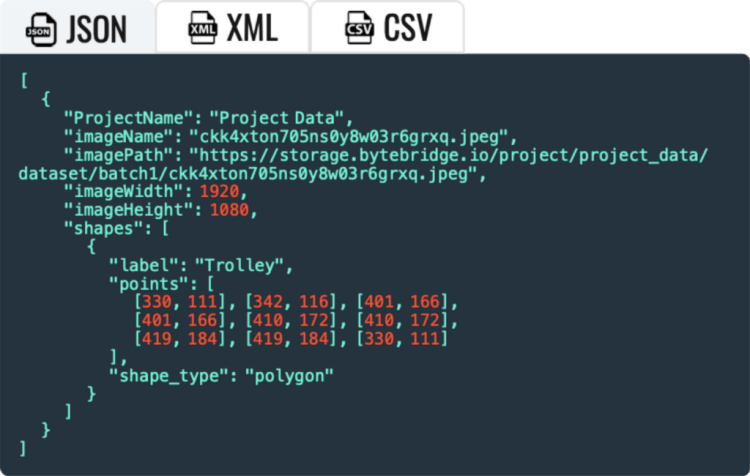
Real-time Outputs: clients can get real-time output results through API, support JSON, XML, CSV, etc.
ByteBridge: a Human-powered Data Labeling SAAS Platform
*Customizable datatype to meet your needs
End
Designed to empower AI and ML industry, ByteBridge promises to usher in a new era for data labeling and accelerates the advent of the smart AI future.
For more information, please have a look at bytebridge.io, the clear pricing is available.
Over the past year, consumers have become more concerned than ever with physical interactions, hygiene, and the availability of touchless technology in public spaces.
According to the McKinseyconsumer sentiment research, touchless purchases and physical distancing are among the top two priorities for a consumer when they decide to make a purchase in-store. And they are right to have concern.
These concerns are valid as research shows that the concentration of bacteria found on a public self-serve kiosk is 2000 times higher than on a toilet seat.
To address consumer concerns and industry challenges, we have developed this resource to act as a guide to touchless technology as a solution for end-users.
Big Data Jobs
Key Points
In this guide, we will discuss interaction challenges in a post-COVID world, including a definition of touchless technology, and how best to implement it as a solution.
Part A will Cover the Trend Toward Zero UI Touchless Technology
Touchscreens and Shared Devices: Hygiene Concerns — How can touchless technology solve these challenges?
Trending Towards a Zero UI (User Interface): Voice Recognition, Gesture Recognition, and Biometrics as Touchless Interaction Models.
Limitations to Voice and Biometrics: When do you Need Gesture-Based Touchless Interactions?
Part II Will Cover Guidelines to Implementing Touchless Interaction Technology
We will look at use cases and user environment considerations for touchless gesture technology and guidelines to choosing the right touchless technology provider for each scenario.
RGB vs Time-of-Flight cameras
Hand Tracking v. Gesture Recognition: Different Approaches of Touchless Technology
Hardware and Software Bundles v. a Hardware Agnostic Solution
Part C wil cover User Experience Considerations
UI feedback, best practices, the inclusion of technology partners, and accessibility.
Part A — Touchless Technology: Moving Towards Zero UI
1. Touchscreens and Shared Devices: Hygiene Concerns
Touchscreens and shared devices such as kiosks, self-service counters and interactive displays are present in our everyday lives. Each of these interactions however is a concern for consumers in a post-COVID world where hygiene is of utmost importance.
Touchless technology offers seamless integration as a hygiene-conscious solution.
Let’s look at a few examples of touch-based interactions that can be replaced with touch-free interactions.
Examples of Touch-Based Interactions
Touchless controls can be implemented into a wide range of touchscreens, shared devices, and even non-digital interfaces:
Public Spaces
Payment terminals
Phones
ATMs
Wayfinding interfaces
Interactive displays for public use
Workplace
Light switches
Elevator signals
Door handles
Transportation
Ticket and self-service kiosks
Parking meters
Bus fares
Baggage claim
Retail
Wayfinding
Checkout kiosk
In-store virtual try-on experience
Restaurants & Hospitality
Check-in
Order
Special requests
Example of gesture recognition
Touch-Interaction Hygiene Challenges
Many existing solutions such as sanitizing interfaces between use, implementing anti-bacterial sprays, offering hand sanitizer and UV radiation are not easily scalable and require costly supervision.
This poses a challenge for interface and digital display manufacturers and users of those displays such as retail brands, transportation services companies, medical device operators, and many more industries where touch-based controls have traditionally been used.
Touchless Technology as a Solution for Hygienic Interactions
The one-stop solution to hygienic interactions includes touchless technology such as voice control, remote mobile app-based interactions, biometrics, and gesture controls as Zero User interfaces, which we will cover in the next section.
II. Trending Towards Zero UI (User Interface)
With the breakthroughs in image recognition and natural language processing, powered by advanced computer vision and machine learning, we are heading towards what is called “Zero UI” (user interface).
Zero UI: Touch-Free Control Interfaces
Zero UI is a control interface that enables users to interact with technology through voice, gestures, and biometrics such as facial recognition.
It’s also a part of “invisible technology,” interfaces that are so integrated into our day-to-day lives that users rarely consider the technology behind the interaction or experience.
Smart devices, IoT sensors, smart appliances, smart TVs, smart assistants and consumer robotics are predominant examples of devices in which Zero UI is becoming increasingly integrated. Control interfaces include natural interaction modes such as voice or gestures.
Multimodal Zero UI: Interacting with Smart Devices Through Voice, Gestures, or Biometrics
The end-user solution for universal safe and seamless interactions calls for a multimodal Zero UI. This presents options for interaction such as voice and gesture controls, and biometric interactions, often co-existing with touchscreen interfaces.
Presenting users with the right Zero UI solution in each use case will improve service, brand image and accessibility by giving users options that they are comfortable with based on intuition and ability.
3. Limitations to Voice Control and Biometric Interactions, and Benefits of Touchless Gesture Technology
Voice controls may not function in noisy environments such as public spaces or construction sites.
In the case of biometrics, such as face recognition, these have limited functionalities in terms of user controls and inputs, and raise data privacy concerns.
Why should brands and manufacturers consider implementing touchless gesture controls?
They work in multimodal user interfaces in various environmental conditions
They are not as intrusive as biometric controls
Their universal comprehension as interactions works across languages and cultures for a global user base. In applications such as retail centers and airports, this significantly improves the UX at scale.
When should you consider implementing gesture-based interactions?
Loud and noisy spaces such as construction sites, plants and factories where:
Voice controls hampered by noise
Need precise interactions without taking off gloves/gear
Silent environments where voice interaction is disrupting the silence
Where removing gear is not safe: Manufacturing, building sites or medical spaces
When employees wear protection glasses or helmets, complicating biometrics, audio or touch interactions
Where users need accessibility
Unreliable voice recognition (people with accents, the elderly and women’s voices tend to experience more error rates than other groups)
Part B — Guidelines to Implementing Touchless Interaction Technology
In this section, we will look at various offerings of hand tracking and gesture recognition technology. This includes guidelines to choosing the right technology.
First we will look at which hardware is the most appropriate for the business objective of your company, focusing on two types of sensors: RGB cameras, as they are the most commonly found, and Time of Flight (ToF)
We will also look at the difference between hardware and software bundles
Lastly we will look at the differences between gesture recognition and hand tracking technologies.
I. Hardware Considerations: Comparing RGB and Time-of-Flight Cameras
Choosing the right technology provider involves careful consideration as touchless technology solutions are dependent on a device’s sensors and camera(s), and therefore rely on the OEM’s (original equipment manufacturer’s) specifications.
Do you need a specific camera to implement gesture controls?
Factors such as existing hardware, budget, and user experience will determine integration specifications.
Depending on a device’s onboard camera and sensors, some may require a custom gesture control solution.
Other technology providers will offer hardware agnostic solutions, able to adapt to hardware configurations, including onboard monochrome cameras.
In this section, we take a look at the two most common cameras embedded on smart displays: RGB and Time-of-Flight.
Touchless interface
Leveraging RGB to Create Engaging Interactive Experiences
Where it works best
Well suited for self-service kiosks inviting the user for a fun and interactive experience in shopping or entertainment centers.
How does it work
RGB cameras capture the same wavelength of light that the human eye is sensitive to red, green, blue.
Pros
Common due to their accessible price, found on smartphones
Allow for consumer-friendly features such as autofocus and blur
High-resolution images
Cons
Color sensors are intrinsically slower, as it needs to process 3 times the amount of data that a monochrome sensor processes. The frame rate is slower.
More sensitive to light and shade, which makes segmentation more challenging than when using IR sensors
RGB cameras can be complemented by a depth sensor, augmenting the traditional image information with depth data.
Time of Flight: High-End Camera for Precision Use-Cases
Where it works best
Environments where high precision interactions are used
How does it work
ToF cameras calculate distances between the camera and the object by projecting an artificial light (laser or LED) onto the object and measuring the ‘time’ it takes for the light to travel out and back.
Pros
More compact than other setups like stereo vision
Captures more details than other cameras at a faster pace
Cons
Using various ToF at the same time may disturb another user’s experience
Background light can mislead the depth measurement
More expensive than RGB or monochrome cameras at scale
2. Hand Tracking Versus Gesture Recognition: Different Approaches to Touchless Technology
Above we discussed implementation considerations of the various types of sensors used to capture gestures.
Regardless of the hardware used to capture images, touchless gesture technologies can vary: from simple gesture recognition to advanced hand-tracking technology.
While it is commonly thought that hand tracking technology is the same as gesture recognition technology, they are substantially different approaches.
Gesture-Based Recognition Technology: A Low Battery-Consumption Option for Basic Touchless Interactions
Gesture-based recognition technologies outline a hand pose and match it to a predefined form.
Most gesture recognition technologies train machine learning models to recognize the form of gesture created by the hand.
Simply, algorithms are trained to identify a hand pose or gesture.
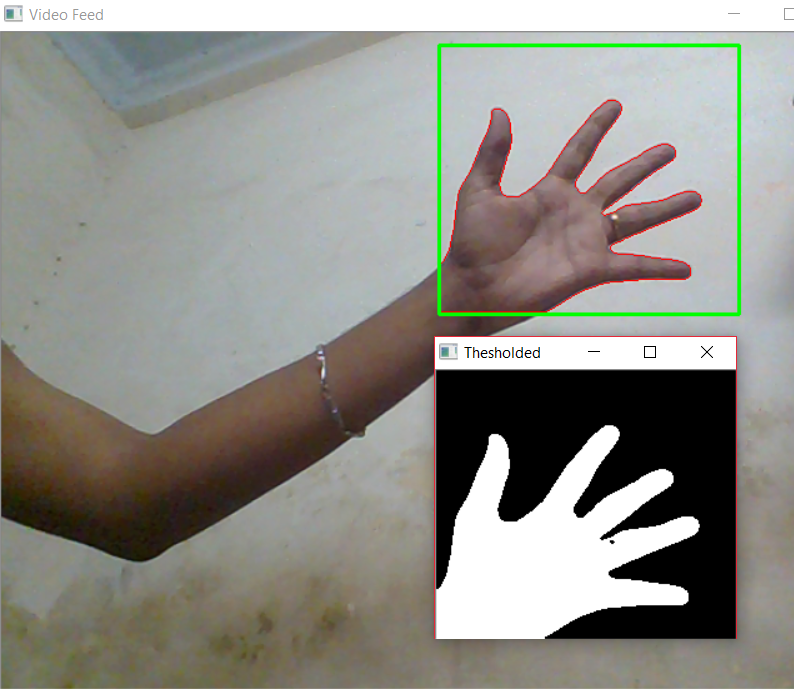
Hand segmentation with contour extraction. Some machine learning algorithms use a shape (contour extraction) to identify hands. — Source
Applications
Practical for situations where a limited number of gestures are needed for simple interactions.
Example: a binary request such as: validate or cancel, and previous or next page
Pros
Low battery consumption
Cons
Not practical for advanced or dynamic user interactions
The software may have difficulty recognizing gestures that vary slightly from the predetermined gesture pose.
Higher risk of false positives
Higher risk of user friction
Devices
Recommended for devices that require low battery consumption
Tracking-First Gesture Recognition Technology: Universal and Highly Accurate Gesture Recognition for Seamless Interactions
Tracking-first gesture recognition technology detects the hand, and then places it in a bounding box. At this point, the recognition technology identifies key points of interest, usually located on the knuckles and palm of a hand.
Depending on the software provider three to twenty-one points of interest are tracked on a hand continuously over the duration of the interaction.
Gestures are recognized when the points tracked in space create a certain combination and therefore more precise than gesture-based recognition technology.
Applications
High performance and safety critical use cases.
Automotive, training, and simulations where highly accurate interactions are integral.
Pros
Advanced gesture recognition for complex interactions.
Highly accurate, even when gestures differ slightly between users.
Self-learning, adapts to users.
Cons
In some cases, higher battery consumption (requires more computational power).
Devices
Self-service kiosks, check-in booths, touchless check-in, wayfinding kiosks, in-car gesture controls, retail, hospitality and service interaction displays and interfaces.
III. Hardware and Software Bundles v. a Hardware Agnostic Solution
A hardware and software bundle may offer a compelling package upfront in terms of initial deployment and pricing.
In the long term, co-dependencies between the hardware and software and other providers may result in a provider lock-in that is harmful to long-term flexibility and growth.
On the other hand, a hardware agnostic solution means that gesture control models can be implemented with a variety of cameras and multimodal interfaces.
It is a more reliable solution to deploy as a cohesive experience across multiple devices. This is far more cost-effective in the long run and highly adaptable.
Part C — User Experience Considerations: From Provider Selection to UI design
In this section, we will consider the user experience in relation to the technology used for touchless gesture controls, inclusivity and accessibility design considerations, and the importance of choice for multimodal interactions.
Minimize the User’s Effort
Technology partners play a key role in designing the user experience. A track record in human-machine interaction design, user experience design guideline standards and best practices for usability are important to evaluate ahead of time to optimize the impact of a solution’s implementation.
This will reduce points of friction during user interactions, and boost the overall rating of the experience.
UX capabilities to look for when choosing your technology partner include:
Guidelines on visual feedback, cues and signals to guide a user through a new interface
Awareness and guidelines on the cultural meanings of hand poses and gestures
Inclusive technology and UX
Inclusive and Accessible by Design
Hand tracking and gesture recognition technology is advancing to accommodate individuals who may be uncomfortable with touch or voice interactions.
All hand colors and sizes, hands with or without accessories, and hands that belong to eldery or youthful individuals should be equally recognized and understood.
This ability comes down to the practice and approach of a technology provider. Inclusivity and accessibility is deeply linked with machine learning and the data used. As such, a technology provider must work with a diverse range of data to create a solution that works for a diverse body of users.
As discussed above in multimodal touchless control solutions, voice, and gesture controls are solutions that can complement one another. In specific environments, a certain combination of multimodal touchless solutions will provide the best result.
Choice also provides the consumer with their preferred means of interactivity, creating a meaningful experience to consumers who feel their needs have been addressed with a personalized solution.
Summary
In summary, interactions in a post-COVID world are leaning towards Zero UI, accelerated by hygiene considerations.
Touchless technologies for gesture controls is optimal in a multimodal control interface, and addresses consumer concerns with data protection, privacy, and ease of use.
When it comes to choosing and implementing gesture-based interactions, many factors are to be taken into consideration:
What is your existing technology stack? Do you need retrofitting?
Is the technology partner compatible with your hardware?
What technology is your partner offering? Is the solution power-efficient, accurate and versatile?
Is the technology provider offering advice and support on the user experience design?
What about post-implementation improvement?
With any additional questions on these guidelines, don’t hesitate to contact our team here.
I’m a recently graduated engineer with a degree in artificial intelligence. As a Machine Learning Engineer, I have a strong appetite for the problems related to computer vision, my favorite field.
Most people are familiar with the supervised learning methods of learning a task from labels. This is one of the most common tasks in machine learning or deep learning.
Today I will give you a brief introduction about self-supervised learning, which allows you to learn a task without a label. I’m going to give you a brief introduction on self-supervised learning, which allows us to learn a task without a label giving us the possibility to pre-train models on billions of examples without needing to label the data.We have begun to see the emergence of these models trained on large corpora not annotated in natural language models (example: GPT-3).
Big Data Jobs
How to train a model without labels?
Methods for self-supervised learning generally formulate some kind of supervised signal from an unlabeled dataset. In the case of natural language processing models, an unlabeled corpus is used to predict the next word from a context or the hidden word etc. These tasks are called pretext tasks.
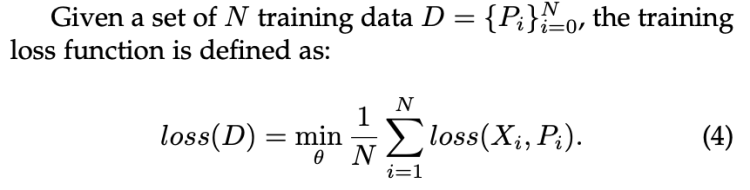
In computer vision, Jing et al. have provided us with a definition of what is a pretext for a visual representation. They defined a pretext task, by learning not based on labels but on the intrinsic characteristics of the image (image context, etc…). We thus generate pseudo label Pi allowing to train our model on a large amount of images without annotation.
Figure 1: Loss based on pseudo label generated from images
The advantage of these models is to provide a pre-trained model on a large corpus of images and then use it to process downstream tasks with a clear improvement in performance compared to training them from scratch.
What is the problem with self-supervised learning?
In theory, we can clearly say that we could train a model with an infinite number of images, right? Not really. Indeed, to assign these images to pseudo Pi labels, we need to group them according to common characteristics. To do this there are essentially two methods.
Clustering-based approaches, which will create groups of images based on the similarity of their characteristics. We will use existing models like a ResNet50 for example to extract the features of each image and then apply a clustering on these features to create K groups of images.
Noise contrastive estimation based approaches, these approaches allow to maximize the semantic similarity between two similar images and on the contrary to minimize the similarity between two different images. If you are interested in learning more about the topic, you can read this article or the original research paper.
Both approaches suffer from problems related to the computation time and resources required, which limit the approach to training models on small image corpora.
Most clustering methods require a forward pass which must be performed locally and limits the use of this method.
Methods based on Noise Contrastive Estimation compare images in pairs. They use strong data augmentation methods (random crop resizing, color distortion, rotation etc…). We quickly understand that comparing images by pair on large corpus becomes very expensive.
Motivated by these problems SwAV brings an answer to the computation time problem, using an online clustering, it also introduces the notion of multi crop policy which allows to introduce multiple views of the same image without add a huge computational cost. This method has drastically increased the performances as we will see in the next part.
SwAV: a powerful self-supervised approach
SwAV solves computational problems by taking the advantages of contrastive loss without using pairwise image comparison, which allows it to be scalable. To do so, it uses a clustering method that guarantees consistency for transformations of the same image. It guarantees that the transformations from the same image will be in the same cluster.
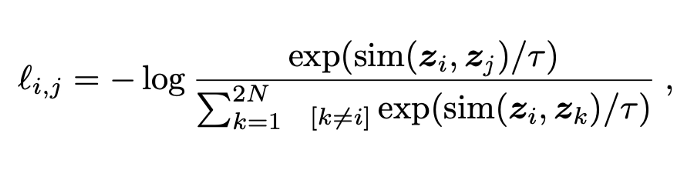
Contrastive Loss
Figure 2: Contrastive Loss
In the original definition of contrastive loss, one has to compute the similarity between each pair of images which quickly becomes intractable. To solve this problem, SwAV avoids comparing every pair of images by mapping the image features to a set of trainable prototype vectors.
Online Cluster Assignments and Contrasting Them
SwAV introduces an online clustering mechanism based on the assignment to a code that will be shared between the different batches. The advantage of this method is that it is totally scalable, one can imagine being able to apply it to an unlimited number of images. Nevertheless, in reality some constraints exist. We are going to go into a little more detail in the functioning of the clustering done by SwAV.
Figure 3: SwAV method
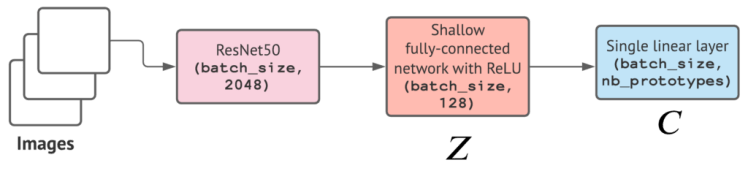
SwAV starts by taking an image X, then selects two transformations t1 and t2 from the set of transformations T applicable to an image. Then from these images it applies a nonlinear transformation f_theta. In our case f_theta can be the features generated by a ResNet50projected to an unit sphere for example to obtain z1 and z2 respectively from x1 and x2.
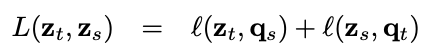
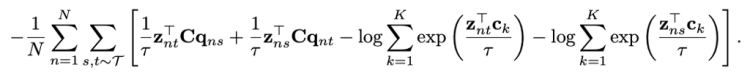
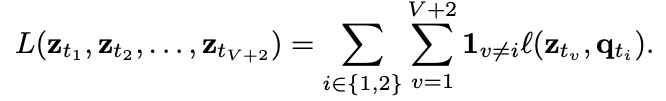
Now, we try to assign a prototype to each zt feature. We then setup a “swapped” prediction problem with the following loss function:
Figure 4: Swap Loss function
Intuitively, their method compares the features zt and zs using the intermediate codes qt and qs. If these two features capture the same information, it should be possible to predict the code from the other feature. A similar comparison appears in contrastive learning where features are compared directly.
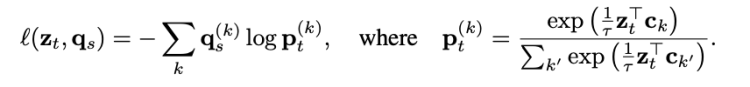
To do so, we will try to assign the prototype c_k which maximizes the softmax of dot product between z_t and c_k. This function is the cross entropy loss between the code of other augmented image and the probability obtained by taking a softmax of the dot z_t and c_k.
Figure 5: loss function
where the function l(z, q) measures the fit between features z and a code q, as detailed later.
If we generalize the loss function to the set of image pairs for all batches, we obtain the following loss function.
Figure 6: Global loss function
This loss function does not allow to perform an online training on a large number of images, indeed it requires to compute the loss on all pairs of images and batches, forcing us to do the training locally. To solve this problem Mathilde Caron and al. had the idea to apply their function and assign prototypes to the batch level allowing a generalization of their method.
The codes are computed using the prototypes C such that all the examples in a batch are equally partitioned by the prototype. The equipartition constraint is very important here as it ensures that the codes for different images in a batch are distinct, thus preventing the trivial solution where every image has the same code.
Given B feature vectors Z = [z₁, z₂, . . . , z_B], we are interested in mapping them to the prototypes C = [c₁, . . . , c_K]. This mapping or the codes are represented by Q = [q₁, . . . , qB], and Q is optimized to maximize the similarity between the features and the prototypes, i.e. To explain it more simply, Q is the dot product between Z and the weight of shallow layer which represent C.
Figure 7: Maximize similarity between prototype and features
where H is the entropy function and ε is a parameter that controls the smoothness of the mapping. This equation represents the optimal transport problem, a well known problem already solved by Sinkhorn-Knopp algorithm.
Asano et al. [2] enforce an equal partition by constraining the matrix Q to belong to the transportation polytope. They work on the full dataset, and we propose to adapt their solution to work on minibatches by restricting the transportation polytope to the minibatch:
Figure 8: Constraint Matrix Q to assure each image is assigned to a different prototype
where 1_K denotes the vector of ones in dimension K. These constraints enforce that on average each prototype is selected at least B/K times in the batch.
Figure 9: Optimal solution for Q transport matrix
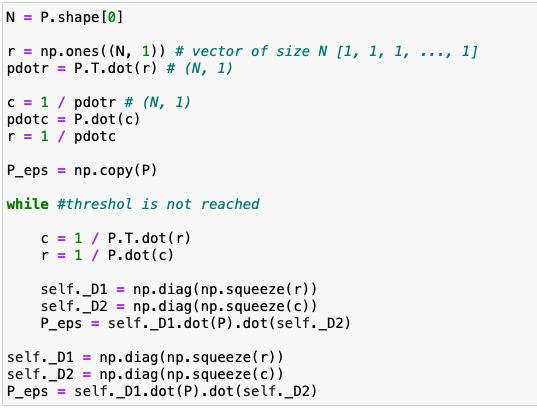
The optimal solution for the Q matrix is defined by Figure 9, where u and v are renormalization vectors in R^K and R^B respectively. The renormalization vectors are computed using a small number of matrix multiplications using the iterative Sinkhorn-Knopp algorithm.
What are the prototypes ?
Figure 10: a simplify view of SwAV
The C prototypes are represented by a shallow layer the weights of this dense layer represent the prototypes that will be learned during the back-propagation step. The output of this shallow layer represents our Q matrix, which we transform into a Q* (the solution of problem defined in Figure 9) matrix that represents the probability of being assigned to the prototype C_k (i.e. to cluster k) which maximize the similarity between prototype and features. To find this matrix Q*, their used the Sinkhorn-Knopp describe in the next section.
Sinkhorn-Knopp algorithm
What does the Sinkhorn-Knopp algorithm actually do? It transforms a non-negative matrix Q, into a doubly stochastic matrix Q*, I will come back to the term doubly stochastic matrix in more detail. To do this, the algorithm looks for two diagonal matrices u and v such that Q* = uQv.
A doubly stochastic matrix, is simply a matrix which all the sum of rows or lines are equal to one.
In our case, the Q matrix represent the dot product between the prototype C and the feature extracted for some images Z. It means, that the Q matrix represent the probability of matching with one of the prototypes.
Here is the pseudo code of this algorithm.
Figure 11: Pseudo code of Sinkhorn-Knopp algorithm
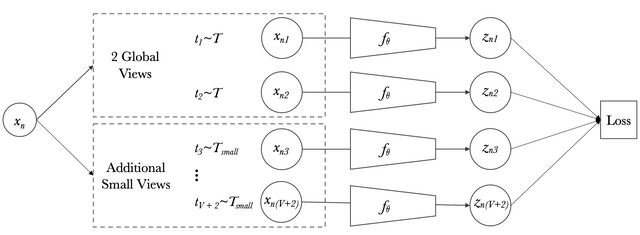
Multi-crop: Augmenting views with smaller images
Figure 12: Multi-crop
We can quickly understand the interest of having multiple views of the same image from different augmentation methods to facilitate the training of the model. However, adding these image peers will increase the time complexity and the memory quadratically.
Mathilde Caron et al. had the idea of introducing low-resolution images in the training in addition to the two high-resolution images. The advantage is that this method allows to increase the learning base without increasing too much the computation time and the memory.
Figure 13: Multi-crop loss
Results
Figure 14: performance
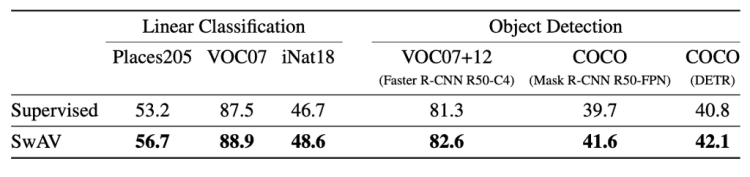
This table summarizes the performance of a ResNet50 trained with supervision or with SwAV. We can see that SwAV is better in all cases.
For the linear classification the metric is the top-1 accuracy, except for VOC07 where the authors used the mAP (mean Average Precision). For the object detection part, they used the classical metrics AP_50(Average Precision with IoU (Intersection over Union) = 0.5) for VOC07+12 and AP (Average Precision) for COCO.
What is RegNetY ?
Figure 15: Design space design
Today we see that in many computer vision applications the improvements are due to the use of convolved networks more or less dense, deep, wide, or by adding residual blocks. But these architectures are essentially defined empirically by hand. To solve this problem Ilija Radosavovic et al. defined spaces containing parameterizations of convoluted networks (width, depth, …), then through their analysis succeeded in defining a subspace named Regenet. This new space is a lower dimensional space containing simple regularized networks. The core insight of the RegNet parametrization is surprisingly simple: widths and depths of good networks can be explained by a quantized linear function. They analyze the RegNet design space and arrive at interesting findings that do not match the current practice of network design. The RegNet design space provides simple and fast networks that work well across a wide range of flop regimes. Under comparable training settings and flops, the RegNet models outperform the popular EfficientNet models while being up to 5× faster on GPUs.
Designing Network Design Spaces
A design space is a large, possibly infinite, population of model architectures. The core insight from is that we can sample models from a design space, giving rise to a model distribution, and turn to tools from classical statistics to analyze the design space. In this work, they propose to design progressively simplified versions of an initial, unconstrained design space. We refer to this process as design space design.
How to get a model distribution?
To obtain a model distribution the authors chose to randomly draw n=500 parameterizations and to train these 500 models from a design space. To gain in efficiency we will train the models with few epochs and in low compute (i.e. with reasonable input dimensions).
Now that we have our model distribution we need to define an error function to characterize the performance of our models.
Figure 16: error empirical distribution function (EDF)
F (e) gives the fraction of models with error less than e. This function will allow us to evaluate the quality of a model distribution from our space.
To summarize:
(1) we generate distributions of models obtained by sampling and training n models from a design space
(2) we compute and plot error EDFs to summarize design space quality
(3) we visualize various properties of a design space and use an empirical bootstrap to gain insight
(4) we use these insights to refine the design space
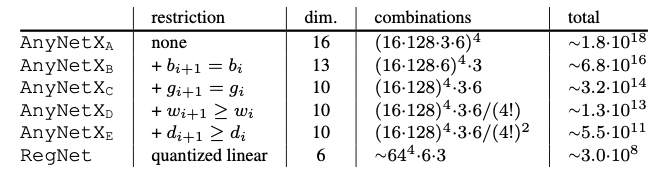
The AnyNet Design Space
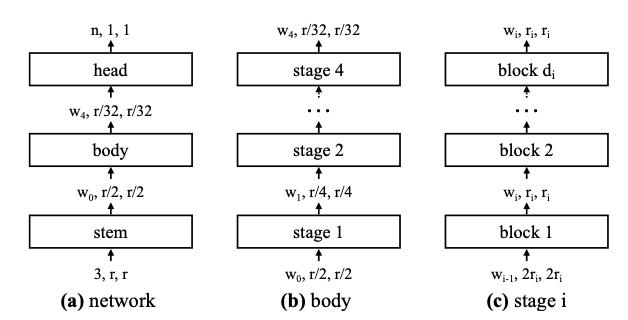
The authors use a neural network composed of two parts:
A head: which is composed with Fully Connecter Layer and a softmax function to predict a class
A body: consists of 4 stages operating at progressively reduced resolution. Each stage consists of a sequence of identical blocks.
Figure 17: Network architecture
The stem and head part are fixed, they only tried to optimize the feature extraction (i.e. backbone).
The body consists of 4 stages, each stage i contains a number di of blocks, of width wi, as well as other parameters related to the convolutional network like bottleneck ratio bi, and group width gi. We immediately realize that the number of possible combinations is very large, we have 16 degrees of freedom for each stage.
To obtain valid models, they perform log-uniform sampling of di ≤ 16, wi ≤ 1024 and divisible by 8, bi ∈ {1,2,4}, and gi ∈ {1,2,…,32}. They repeat the sampling until we obtain n = 500 models in their target complexity regime (360MF to 400MF), and train each model for 10 epochs.
There are (16·128·3·6)^4 ≈ 10^18 possible model configurations in the AnyNetX design space. Instead of analyzing the complete space, they looked for factors without influence on the empirical error capable of simplifying the initial space. For example they created the AnyNetXb space which shares a bottleneck index bi=b between the different stages. They observed that the empirical error did not vary between the initial AnyNetX space and the new AnyNetXb space. They repeated this operation to create other simpler and smaller subspaces.
Figure 18: EDF AnyNetXa vs AnyNetXb
Finally, we are able to find an AnyNetXe space with a cumulative reduction of O(10⁷) compared to the initial AnyNetXa space.
The RegNet Design Space
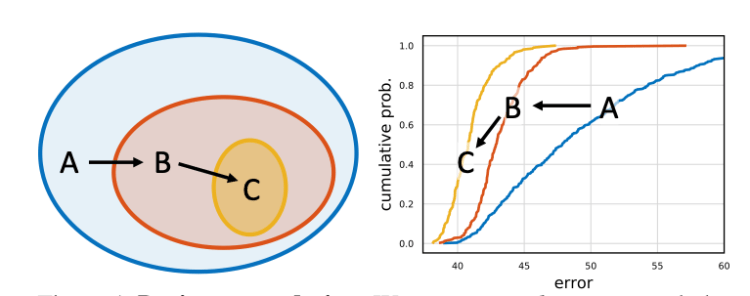
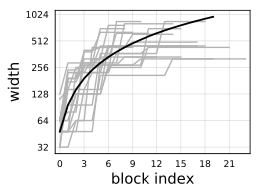
Figure 19: 20 best models for AnyNetXe
Figure 19 shows the relationship between the place of the block and the width wi, we can see that despite the fact that there is a large variance between the results obtained by the different models, we are able to define a linear function able to represent the relationship between the place of the block (i.e. the depth di) and the width wi.
Figure 20: relation between width and block index j
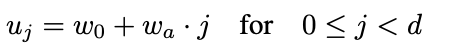
The figure 20, introduce the linear function which capture the link between the width wi and the index of block j. d is the depth, j the index of block, w0 the initial width, w_alpha > 0 (i.e. positive to indicate that the width increase when the index j increase) the slope.
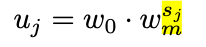
To quantify uj, they introduced a new parameter wm > 0, then for each block we have to compute sj based on the previous result of uj in Figure 20.
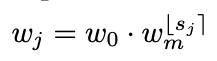
Then, to quantize uj , we simply round sj (denoted by ⌊sj⌉) and compute quantized per-block widths wj via:
We can convert the per-block wj to our per-stage format by simply counting the number of blocks with constant width, that is, each stage i has block width wi = w0*wm^i and number of blocks di with the following formula.
This parameterization have been tested by fitting to models from AnyNetX. The resulting design space is referred to as RegNet.
RegNet is not a single but a model space constrained by linear quantization that is supposed to contain a powerful set of models while having an optimized number of parameters ensuring inference with acceptable speed and better scalability.
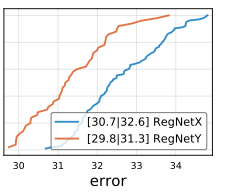
Figure 21: Comparison between RegNet and AnyNet
As shown in Figure 21, the models selected within the RegNet space are always better than the models from AnyNet in terms of cumulative empirical error.
The RegNetY space
Figure 22: Squeeze and Excitation block
The space of RegNetY takes the characteristics of RegNetX by integrating a modification of the stages, for each succession of block in a stage we add a block called squeeze and excitation. The purpose of this block is to learn a weight indicating the importance of a channel in a block di.
This SE (Squeeze and Excitation) block is composed with the following layer:
A global average pooling layer to squeeze each channel to an unique number
A fully connected layer followed by a ReLU function adds the necessary nonlinearity and reduces the dimension of the input by a ratio which is an hyper-parameter
A second fully connected layer followed by a Sigmoid activation return a weight for each channel, and assign a constraint that the sum of weight is equal to 1.
At last, we weight each feature map of the convolutional block based on the result of our SE block.
This architecture provided a significant improvement over the RegNetX space (i.e. Figure N).
Figure 23: empirical cumulative error between RegNetX and RegNetY
SEER
Model
SEER is a model trained with the SwAV method which allows to train a model on a large corpus without label, it uses an architecture based on the RegNetY space following the parametrization in figure 24. In this case the corpus was composed by1B random, public and non-EU Instagram images
Figure 24: RegNetY parametrization
It has 4 stages with stage depths (2, 7, 17, 1) and stage widths (528, 1056, 2904, 7392), leading to a total of 695.5M parameters.
For the training, they used the following configuration:
RegNetY-256GF with SwAV using 6 crops per image of resolutions 2 × 224 + 4 × 96
Multi-crop data augmentation
During pre-training, they use a 3-layer multi-layer perceptron (MLP) projection head of dimensions 10444 × 8192, 8192 × 8192 and 8192 × 256
16K prototypes
Temperature τ set to 0.1
Perform 10 iterations of Sinkhorn algorithm
Use a weight decay of 10^−5
LARS optimizer and O1 mixed-precision optimization from Apex library
Train their model with stochastic gradient descent with batch size of 8192
Performance
Finetuning Large Pretrained Models
Methodology:
Pretrain 6 RegNet architectures of different capacities, namely RegNetY–{8,16,32,64,128,256}GF, on 1B random, public and non-EU Instagram images with SwAV
Finetune these models on the task of image classification on ImageNet, using the standard 1.28M training images with labels
Evaluate on 50k images in the standard validation set
The table above shows that ResNetY-128 and 256 outperform the SOTA methods with a Top-1 accuracy of 83.8 and 84.2 respectively on imageNet.
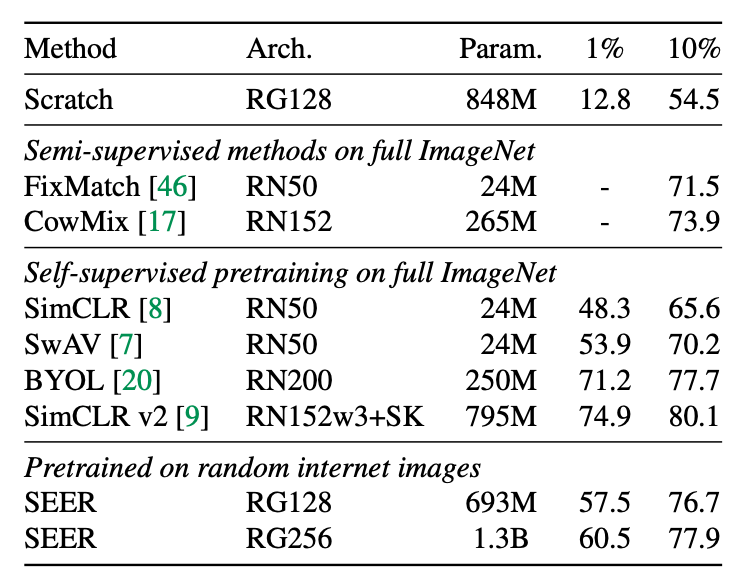
Low-shot learning
Low-shot learning is a method consisting in pre-training a model on a large base of images in our case and fine tuning it on a small fraction of the task we want to solve.
Methodology:
Use a the same pre-trained models
Consider two datasets for low-shot learning, namely ImageNet and Places205
Assume a limited access to the dataset during transfer learning, both in terms of labels and images
They compare their approach with semi-supervised approaches and self-supervised pre-training on low- shot learning. Their model is fine-tuned on either 1% or 10% of ImageNet, and does not access the rest of ImageNet images. As opposed to the other methods, the other methods use all the images from ImageNet during pre-training or fine-tuning.
Nonetheless, this approach achieves a top-1 accuracy of 77.9% with only 10% of ImageNet, which is competitive with these methods (2% gap). On 1% of the data, i.e, 10K images, the gap increases significantly but note that the other methods are using the full ImageNet from pre-training.
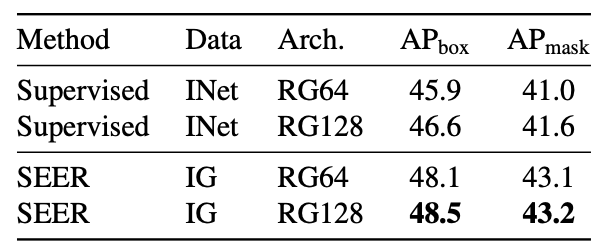
Detection and segmentation
Method:
Train a Mask-RCNN model on the COCO benchmark with pretrained RegNetY-64GF and RegNetY-128GF as backbones
For both downstream tasks and architectures, our self-supervised pre-training outperforms supervised pretraining by 1.5 − 2 AP points. However, the gap in performances between different architectures is small (0.1 − 0.5 AP) compared to what we observed on ImageNet.
Conclusion
During this article, I have introduced many concepts. We can make a summary of all these concepts.
SwAV, a self-supervised learning approach which opens the door to training generic computer vision models on a large number of unlabeled data
RegNet an effective design space according to those principles, and a family of SOTA models for many computer vision task, highly scalable
SEER a RegNetY based model having used SwAV to pre-train a generic computer vision model that can be fine tuned on downstream tasks by beating SOTA models
This new method opens the door to the training of generic computer vision models as found in natural language processing with GPT-3, trained on billions of images capable of pushing computer vision even further on many tasks and significantly improving performance.
Few things are as demoralizing as seeing your data analysis tossed aside. Learn from these tips — assembled from experience, academic research, and industry best practice — on how to make sure your hard work receives the credit it deserves and delivers the value to your organization that you expect.
Shapash: Making Machine Learning Models Understandable; KDnuggets Top Blogs Reward Program; Easy AutoML in Python; The 8 Most Common Data Scientists; A/B Testing: 7 Common Questions and Answers in Data Science Interviews, Part 1; Top 10 Python Libraries Data Scientists should know in 2021