365 Data Science is an online educational career website that offers the incredible opportunity to find your way into the data science world no matter your previous knowledge and experience.
Preparing to interview for a Data Scientist position takes preparation and practice, and then it could all boil down to a final review of your skills. Based on personal experience, these tips on how to approach such a review will help you excel in the coding challenge project for your next interview.
So, in this article, we’ll discuss how to become a business analyst.
We’ll discover who the business analyst is, what they do, how much they make, and what skills and academic background you need to become one.
You can also check out our video on the topic below or scroll down to keep on reading.
What Is a Business Analyst and How Do They Fit Inside a Company?
The title “Business Analyst” sounds a bit generic at first and may cause hesitation among entry-level candidates. However, the fact that this is a flexible position could be encouraging as the business analyst role encompasses many different activities in a firm. In fact, depending on the organization, this can be an entry-level position or a role for experienced professionals. This means business analysts engage with a wide variety of tasks and the business analyst job description from one firm to the other can be very different. In different businesses, business analysts will be focused on some of the following types of activities:
Process and systems improvement (in terms of efficiency and effectiveness)
Solving business problems
Looking for savings and efficiencies
Focusing on business development and searching for new opportunities
Performance analysis
Competitor analysis
Indeed, “business analyst” is one of the most dynamic roles in a company. They may report their findings to the head of a particular division they are assigned to; or alternatively, they might be discussing a specific case with a product or a project manager. And, in some instances, the business analyst serves as the link between the business development manager and the respective head of division or product owner. One thing is for sure – you will never be bored on the job.
That was the elevator pitch of this exciting job role. But to gain a better understanding of what it means to be a business analyst, we need to take a closer look at their typical day-to-day responsibilities.
What Does a Business Analyst Do?
The answer is – it varies.
In different companies, business analysts carry out different activities. But here are some of the most common business analyst roles and responsibilities.
Business analysts analyze the performance of a particular segment in a company. Very often, they engage with the analysis of different processes, defining goals, and formulating hypotheses. Their effort is to optimize the performance of the particular segment of the company they have been assigned to.
They not only collect data but also apply data-driven decision making, communicate findings, and oversee the implementation of these findings.
What’s more, business analysts often conduct training for non-technical team members.
So, we can safely say that business analysts are the best communicators among problem-solvers and are always ready to lend their expertise across the organization.
The division business analysts are assigned to can be Sales, Supply chain, Administration.
Within that structure, they conduct research, try to rely on data as much as possible, and are typically involved in creating dashboards and other BI tools that allow for easier communication of their findings.
What Is a Business Analyst Salary?
How much does a business analyst make? According to the data, a business analyst earns $68,346 on average. So, if you’re making the first steps as an entry level business analyst, you can expect a median salary of $50k a year. Of course, as you gain more experience, your annual pay will also go higher – the senior business analyst salary reaches up to $93k! Pretty awesome, right?
What Is the Business Analyst Career Path?
A business analyst job is a great option to explore, both on its own and as the first step on the career ladder to becoming a Product Lead, Head of Product, or Head of Division, and, why not a VP.
Most middle and large companies across all industries – including Consulting, Finance, and Tech – offer full-time business analyst positions.
Consultancy is also very popular for this profession, especially in smaller organizations. However, this option provides a business analyst with a limited view of the business compared to their counterparts employed by a company in a specific industry.
What Business Analyst Skills You Need to Acquire?
We researched 1,395 business analyst jobs to discover the desired tools and skills business analyst candidates must have.
In terms of business analyst education, 66% of the job posts require a Bachelor’s degree. This is the standard for this profession.
What Is the Necessary Business Analyst Experience?
Most employers in our sample required an average of 4 years on the job. However, 35% of job ads were also suitable for people with no prior working experience.
So, to sum up – if you want to maximize your chances of landing a business analyst job, you definitely need to be proficient in Excel and you need strong communication skills. And, possibly, learning a BI software (like Tableau or PowerBI) could give you the edge too.
Now you’re aware of the most important aspects of the business analyst position, what to expect from the job, and what skills to focus on to become one.
New book, “Deep Learning Design Patterns” presents deep learning models in a unique-but-familiar new way: as extendable design patterns you can easily plug-and-play into your software projects. Use code kdmath50 to save 50% off.
Richter’s Predictor— Data Challenge from DrivenData
Scoring in the top one percent in the Richter’s Predictor: Modeling Earthquake Damage on DrivenData.
Next to Kaggle there are many other websites which host highly relevant and competitive data science competitions. DrivenData is one of these websites. The main difference between the renowned Kaggle and DrivenData is probably the topics of the challenges. Wheras Kaggle hosts more commercially driven competitions, DrivenData focuses more on philanthropic topics.
We, data4help, took part in one of their competitions and scored out of around 3000 competitors in the top one percent. This blogpost explains our approach to the problem and our key learnings.
01 Introduction — Problem Description
The project we chose is called Richter’s Predictor: Modeling Earthquake Damage. As the name suggests, the project involves predicting earthquake damages, specifically damage from the Gorkha earthquake which occurred in April 2015 and killed over 9,000 people. It represents the worst natural disaster to strike Nepal since the 1934 Nepal-Bihar earthquake.
Our task in this project to forecast how badly an individual house is damaged, given the information about its location, secondary usage, and the materials used to build the house in the first place. The damage grade of each house is stated as an integer variable between one and three.
Machine Learning Jobs
02 How to tackle the project — Plan of attack
The key to success in a Kaggle/ DrivenData challenge, just like in a data challenge for a job application, is a solid plan of attack. It is important that this plan is drafted as early as possible, since otherwise the project is likely to become headless and unstructured. This is especially problematic for data challenges for a job application, which generally serve to gauge whether a candidate can draft a solid strategy of the problem and execute it in short amount of time.
Therefore, one of the first things to do is to get a pen and paper and sketch out the problem. Afterwards, the toolkit for the prediction should be evaluated. That means we should investigate what kind of training data we have to solve the problem. A thorough analysis of the features is key for a high performance.
Do we have any missing values in the data? Do we have categorical variables and if so, what level of cardinality to we face? How sparse are the binary variables? Are the float/integer variables highly skewed? How is the location of a house defined? All these questions came up when we went through the data for the first time. It is important that all aspects are noted somewhere at this stage in order to prepare a structured approach.
After noting all the initial questions we have, the next step is to lay out a plan and define the order in which the problem is to be evaluated and solved. It is worth noting here that it is not expected to have a perfect solution for all the problems we can think off right at the beginning, but rather to consider potential problem areas that could arise.
One of the first steps in any data challenge should be to train a benchmark model. This model should be as simple as possible and only minor feature engineering should be required. The importance of that model is that it gives us an indication of where our journey starts and what a sensible result is.
Given that DrivenData already set a benchmark using a Random Forest model, we will also use that model as a baseline. Before the data can be fed into the model, we have to take care of all categorical variables in the data, through the handy get_dummies command from Pandas. Secondly, we remove the variable building_id which is a randomly assigned variable for each building and hence does not carry any meaning.
From the model_dict we then import the basic random forest model. With just these couple of lines of code, we have a baseline model and baseline accuracy of 71.21%. This is now our number to beat!
In the next sections, we show the steps taken to try to improve on this baseline.
04 Skewness of the integer variables
As one of the first steps in feature engineering for improving on this baseline, we will further investigate all float and integer variables of the dataset. To make all the numeric variables easier to access, we stored the names of all variables of each kind in a dictionary called variable_dict.
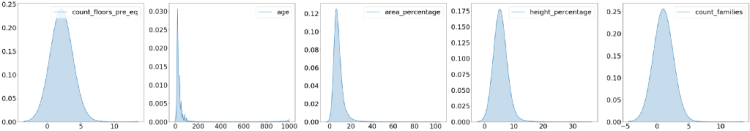
In order to better understand the variables, we plot all integer variables using the package matplotlib:
As we can see from the graph above, all the plots exhibit an excessive rightward skew. That means that there are a few observations for each variable which are much higher than the rest of the data. Another way to describe this phenomena would be to say that the mean of the distribution is higher than the median.
As a refresher, skewness describes the symmetry of a distribution. A normal distribution has, as a reference, a skewness of zero, given its perfect symmetry. A high (or low) skewness results from having a few obscurely high (or low) observation in the data, which we sometimes also call outliers. The problem with outliers is manifold, but the most important problem for us is that it hurts the performance of nearly every prediction model, since it interferes with the loss function of the model.
One effective measure to dampen the massive disparity between the observations is to apply the natural logarithm. This is allowed since the logarithmic function represents a strictly monotonic transformation, meaning that the order of the data is not changed when log is applied.
Before being able to apply that measure, we have to deal with the zero values (the natural logarithm of zero is not defined). We do that by simply adding one to every observation before applying the logarithm. Lastly we standardize all variables to further improve our model performance.
# Applying the logs and create new sensible column names
logged_train = dummy_train.loc[:, int_variables]\
    .apply(lambda x: np.log(x+1))
log_names = ["log_{}".format(x) for x in int_variables]
stand_logs = StandardScaler().fit_transform(logged_train)
stand_logs_df = pd.DataFrame(stand_logs, columns=log_names)
for log_col, int_col in zip(stand_logs_df, int_variables):
    dummy_train.loc[:, log_col] = stand_logs_df.loc[:, log_col]
    dummy_train.drop(columns=int_col, inplace=True)
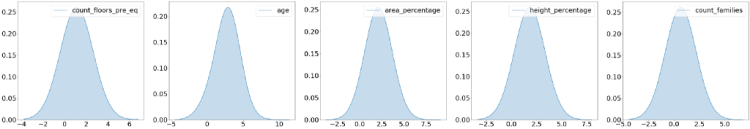
# Plot the newly created plot log variables
fig, axs = plt.subplots(1, 5, figsize=(60, 10))
for number, ax in enumerate(axs.flat):
    sns.kdeplot(logged_train.iloc[:, number], bw=1.5, ax=ax,
                shade=True, cbar="GnBu_d")
    ax.tick_params(axis="both", which="major", labelsize=30)
    ax.legend(fontsize=30, loc="upper right")
path = (r"{}\logs_int.png".format(output_path))
fig.savefig(path, bbox_inches='tight')
The graph below shows the result of these operations. All distributions look much less skewed and do not exhibit the unwanted obscurely high values which we had before.
Before moving on, it is important for us to validate that our step taken had a positive effect on the overall performance of the model. We do that by quickly running the new data in our baseline random forest model. Our accuracy is now 73.14, which represents a slight improvement from our baseline model!
Our performance has increased. That tells us that we took a step in the right direction.
05 Geo Variables — Empirical Bayes Mean Encoding
Arguably the most important set of variables within this challenge is the information on where the house is located. This makes sense intuitively: if the house is located closer to the epicenter, than we would also expect a higher damage grade.
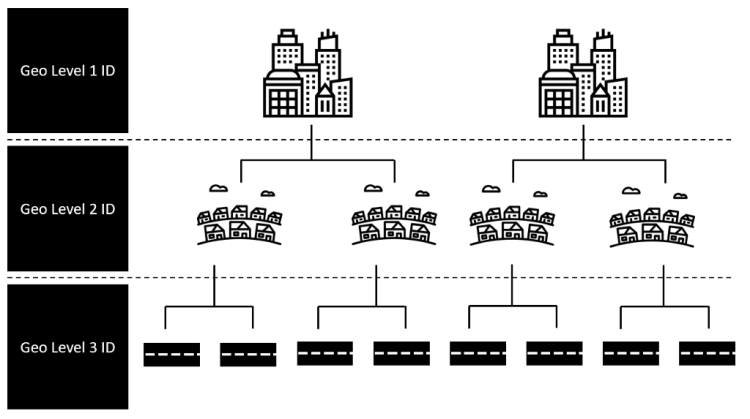
The set of location variables provided within this challenge are threefold. Namely, we get three different geo-identifier with different kind of granularity. For simplicity, we tended to regard the three different identifier as describing a town, district and street (see below).
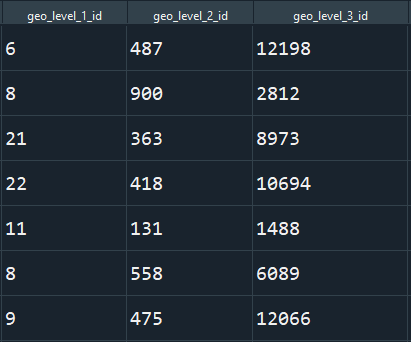
These geo-identifiers in their initial state are given in a simple numeric format, as can be seen below.
These integer do not prove to by very useful since even though in a numeric format, they do not exhibit any correlation with the target (see graphic below). Meaning that a higher number of the identifier is not associated with higher or lower damage. This fact makes it difficult for the model to learn from this variable.
In order to create a more meaningful variable for the model to learn from these variables, we apply a powerful tool, oftentimes used in data science challenges, called encoding. Encoding is normally used when transforming categorical variables into a numeric format. On first glance we might think that this does not apply to our case, since the geo-identifier is given as a numeric variable. However this understanding of encoders is shortsighted, since whether something represents a categorical variable does not depend on the format, but on the interpretation of the variable. Hence, the variable could gain greatly in importance when undergoing a transformation!
There are a dozen different encoding methods, which are nicely summarized in this blogpost. The most promising method for our case would be something called target encoding. Target encoding replaces the categorical feature with the average target variable of this group.
Unfortunately, it is not that easy. This method may work fine for the first geo-identifier (town), but has some serious drawbacks for the more granular second and third geo-identifier (district and street). The reason is that there are multiple districts and streets which only occur in a very small frequency. In these cases, mean target variable of a group with a small sample size is not representative for the target distribution of the group as a whole and would therefore suffer from high variance as well as high bias. This problem is quite common when dealing with categorical variables with a high cardinality.
One workaround for this problem is a mixture between Empirical Bayes and the shrinkage methodology, motivated by paper [1]. Here, the mean of a subgroup is the weighted average of the mean target variable of the subgroup and the mean of the prior.
In our example that would mean that the encoded value for a certain street is the weighted average between the mean target variable of the observations of this street and the mean of the district this street is in. (one varaiable level higher). This method shrinks the importance of the potentially few observations for one street and takes the bigger picture into account, thereby reducing the overfitting problem shown before when we had only a couple of observations for a given street.
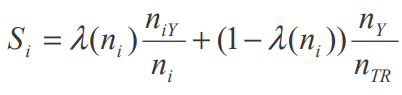
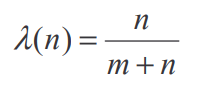
The question may now arise how we are determining the weighting factor lambda. Using the methodology of the paper in [1], lambda is defined as:
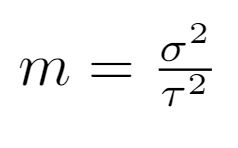
Where m is defined as the ratio of the variance within the group (street) divided by the variance of the main group (district). That formula makes intuitive sense when we consider a street with a few observations which differ massively in their damage grade. The mean damage grade of this street would therefore suffer from high bias and variance (high sigma). If this street is in a low variance district (low tau), it would be sensible to drag the mean of the street into the direction of the district. This is essentially what the m coefficient captures.
It is worth mentioning that the overall model performance in-sample will drop when applying the Empirical Bayes-shrinkage method compared to using a normal target encoder. This is not surprising since we were dealing with an overfitted model before.
Lastly, we run our model again in order to see whether our actions improved the overall model performance. The resulting F1 score of 76.01% tells us that our changes results in an overall improvement.
06 Feature selection
At this point, it is fair to ask ourselves whether we need all the variables we currently use in our prediction model. If possible, we would like to work with as few features as possible (parsimonious property) without losing out too much in our scoring variable.
One benefit of working with tree models is ability to display feature importance. This metrics indicates how important each feature is for our prediction making. The following code and graph displays the variables nicely.
As we can see from the graph above, the most important variables to predict the damage grade of a house is the average damage grade of the different geo-locations. This makes sense, since the level of destruction of one house is likely to be correlated with the average damage of the houses around.
06.1 Low importance of binary variables
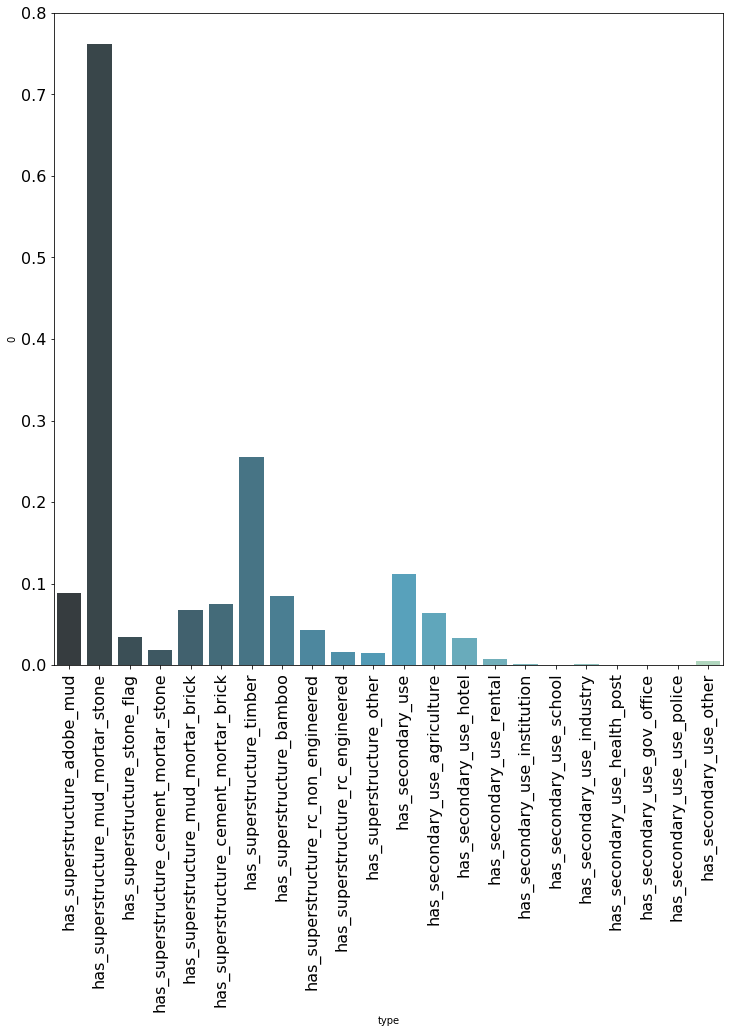
The feature importance also shows that nearly all binary variables have a low feature importance, meaning they are providing the model with little to no predictive information. In order to understand that better we take a look into the average of all binary variables, which is a number between zero and one.
As can be seen above, nearly all variables have a mean below ten percent. That implies that most rows are equal to zero, a phenomenon we normally describe as sparsity. Furthermore, it is visible that the binary variables with an average above ten percent have also a higher feature importance within our prediction model.
This finding is in line with the fact that tree models, and especially bagging models like the currently used Random Forest, do not work well with sparse data. Furthermore, it can be said that a binary variable which is nearly always zero (e.g. has_secondary_usage_school), simply does not carry that much meaning given the low correlation with the target.
Using cross-validation, we find that keeping features which have an importance of minimum 0.01%, leaves us with the same F1 score compared to using all features. This leaves us with 53 variables in total. This number, relative to the amount of rows we have (260k) seems reasonable and therefore appropriate for the task.
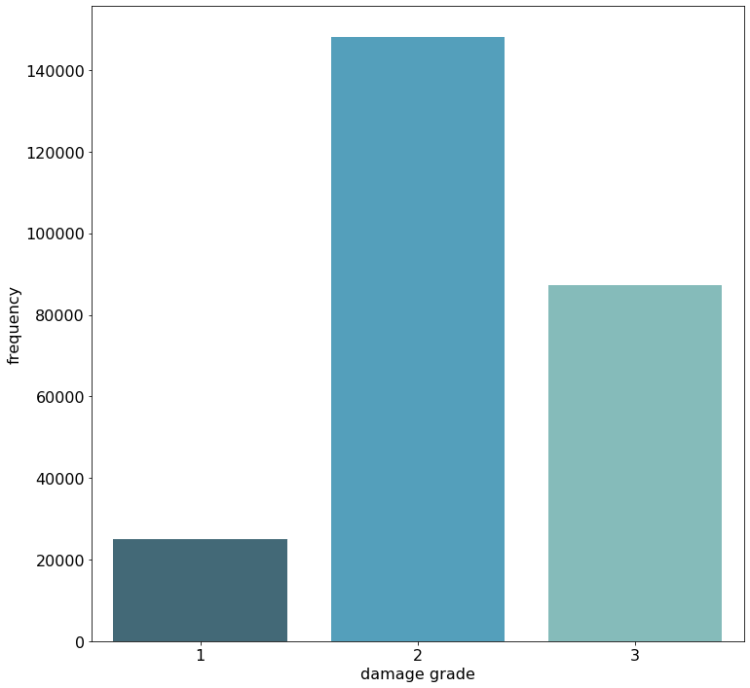
07 Imbalance of damage grades
One of our key learnings in this challenge was how to handle the massive imbalance of the target variable. Namely, not to touch it at all!
When looking at the chart below, we can see that the first damage grade does not nearly appear as often as the second damage grade. It may be tempting now to apply some over- or undersampling to the data in order to better balance the data and to show the model an equal amount of each damage grade. The main problem with this approach is that the test data comes from the same (imbalanced) distribution as the training data, meaning that improving the accuracy score for the lowest damage grade, through sampling methods, comes with the costs of a lower accuracy of the highest occurring, and therefore more important damage grade two.
07.1 Performance & Concluding Remarks
Following all steps of this blogpost (with a few minor tweaks and hyperparameter tuning) led us to place 34 out of 2861 competitors.
We are overall quite happy with the placement, given the amount of work we put in. This challenge touched on many different aspects and taught us a lot. Data Science Challenges are a perfect learning opportunity since they are very close to real life problems.
We are looking forward to our next one!
References
[1] Micci-Barreca, Daniele. (2001). A Preprocessing Scheme for High-Cardinality Categorical Attributes in Classification and Prediction Problems.. SIGKDD Explorations. 3. 27–32. 10.1145/507533.507538.
Enterprises are using multiple types of AI applications, with one in ten enterprises using ten or more. The most popular use cases are chatbots, process automation solutions and fraud analytics. Natural language and computer vision AI underpin many prevalent applications as companies embrace the ability to replicate traditionally human activities in software for the first time, according to MMC Ventures.
Nowadays AI, also as a buzz word, has dominated almost all technology related discussions. I can even risk a statement that there is not a single company in the world that has never considered placing AI at least in their <5 years roadmap planning. Moreover, we use it daily. Be it our smartphones or Amazon devices when we say “Call my wife” or “Alexa, open Pandora” or our TVs/Internet TV boxes while browsing through online streaming repositories and getting recommendations, Cars which display recently recognized road signs, conferencing systems that replace our backgrounds during the so-called “shelter at home” era and many more.
AI systems have traveled a long way since the first official workshops on the subject that were reportedly held around the mid-1950s. Since then and thanks to tremendous progress in many areas like new algorithms design, specialized hardware and cloud services becoming available, so-called data explosion enabling quality AI training, both open-source and proprietary software libraries development, growing investments, number of applications and an increased demand, AI has become a vital tool augmenting human capabilities across industries.
Machine Learning Jobs
One such example whereAIdelivers value is through Machine Vision.Machine Vision or Computer Vision enables machines to identify objects, analyze scenes and activities in real-life visual environments. It does so by leveraging Deep Learning. Sometimes Deep Learning is supported by other techniques which in certain scenarios increase its effectiveness. In other words, thanks to all of these technologies or techniques cameras can see and notify people about i.e. detected fire or quality issues being diagnosed in production lines, count objects on conveyor belts, analyze medical images, monitor buildings and inspect construction areas, or even guide robotic arms through various motions. If something can be captured on a picture or a video, chances are machines can be trained to analyze and identify it as well.
Computer Vision (Machine Vision) enables machines to identify objects, analyze scenes and activities in real-life visual environments.
Possibilities are endless and thanks to many research works being constantly conducted in the space these are mostly limited by humans’ creativity. Needless to say, how greatly such AI systems can help humans become more effective, assist them in demanding and repetitive tasks (i.e. exhausting and manual images or documents analytics), or even offload us from dangerous or simply boring jobs (i.e. “Again, I need to enter these documents into the systems…” — meet John and learn how he solved this problem by reading his story here).
If something can be captured on a picture or a video, chances are machines can be trained to analyze and identify it as well.
???? Through AI Workshop we listen and do our best to understand the needs and goals of our clients and partners. Our experts help them ask proper questions, explain technologies that might be useful and even shadow their teams to better understand daily tasks. Then we assist them in preparing deployment plans and new technology roadmaps. We help understand which challenges could be addressed with existing technologies, which would potentially require additional research efforts, guide about best ways to transform early ideas into tangible results etc.
?? Proof of concept is a natural next step to demonstrate the first tangible benefits: process optimization, task automation, increased system reliability etc. This is also the stage where we help and guide our clients to prepare and collect the right data. Our experienced data scientists help process them and prepare for AI algorithms. Also, some of the key design decisions are taken here. All focused on delivering the most efficient solutions.
?? Solution delivery naturally follows and in our case this is done in Agile sprints, meaning you get results every 2 weeks. One thing worth mentioning here is that we have established a strong research practice for a reason. It happens that most of our clients come with requests where we hardly ever can build an AI system purely from ready-made components. Although computer vision as a technology has already a bucket full of various libraries, track of projects and what have you, at least our projects very often are far more ambitious than what the off-the-shelf components have to offer. Besides, our experience in a very closely related area called HPC (High-Performance Computing) helps us deliver solutions that are truly scalable and produce results efficiently at every stage of the AI application lifecycle: training (=when we teach the algorithms to do certain things) and inferencing (=when the algorithms do their work).
Along the way, and especially in Computer Vision projects, a natural question is: shall we run AI on the server or closer to the data is created or stored? As difficult as the question might sound, the real concerns behind it usually are: what is the amount of data our system is supposed to generate? Are we planning to build small devices that need some sort of AI as well (i.e. a medical diagnostic device)? Is the telecommunication network in our factory reliable? Will it offer enough bandwidth? And many others we help our clients and partners consider during the AI Workshop phase.
Another tricky part is related to hardware design but here the rule of thumb is that most of our clients leave this task to us. And this is also where we closely work with our partners to select the right components, be it an embedded device or a large scale data center.
byteLAKE’s Edge AI
Then comes the real use case. We have delivered plenty and started wrapping some of them up into our products. Let me only mention a few to show how AI, and Machine Vision in particular bring value across industries.
Manufacturing / Industry 4.0 / Factories
Here most of the scenarios we have been working with are about production lines monitoring and dangers identification. Sometimes it is about product quality inspection. There the cameras are used to monitor the products on conveyor belts. Highly optimized AI algorithms take pictures, analyze them in real-time and notify other systems immediately as faulty products or irregularities are identified. In other situations, byteLAKE’s solutions monitor production processes and detect i.e. dangerous situations (like oil stains potentially causing failures), unusual incidents (like wrong proportions in chemical substances potentially generating issues) etc. Bottom line is that instead of forcing humans to look for hours at certain areas just to wait for events that might or might not happen, we might as well consider placing AI-powered cameras there to monitor and notify us about suspicious events.
Hospitality / Hotels
We are working on another product of ours, in consortium with a company named Protel (Turkey). While this is not yet a time to share the details (press release is being planned), I can tell that the AI-powered cameras will support a variety of self-service related functionalities. Nevertheless, if you happen to work in the hotel industry, do reach out to us as for sure we are about to have something cool for you and your visitors.
Agriculture / Forestry / Government / Medical
Many scenarios. From trees counting and illegal dumping areas localization, through traffic analytics, and to complex visual data analysis directly on the small, constrained, embedded devices. Other times it’s about building monitoring and i.e. detecting certain behaviors at the entry gates (i.e. people wearing a helmet). We are also working with 3D visual data and building systems that guide robotic arms to perform various tasks. 3D medical data analytics and numerical algorithms for implants related work have also been within the scope of our work.
Artificial intelligence or AI is used — often unnoticed by humans — in more and more areas. This is also the case in the real estate industry, where the capabilities of neural networks open up new opportunities for the sale, operation, and maintenance of buildings. The areas of application in the real estate industry are diverse. Four areas stand out in particular.
Neural networks can be roughly differentiated by the extent to which they take on tasks autonomously. In some areas, AI acts without human intervention; in others, it merely supports him in various activities. Systems of different types can also be found in the real estate industry. The solutions presented below are already in use or ready for the market within the next few years.
But why AI? Homo sapiens is good at making connections between “obvious” facts. For most of us, the following argument should seem logical: “People with children buy a property with a garden more often.” Artificial intelligence is powerful because it does not perceive the world in three dimensions without social imprint. Thanks to machine learning, it sees and processes information fundamentally differently than living beings.
As a result, neural networks are increasingly able to establish connections between aspects that are less obvious to humans: “People with children aged 2–4 are most likely to buy a property with a garden on Tuesdays when it is not raining. When the outside temperature is more than 18 degrees. “
Machine Learning Jobs
AI is more than Siri and Alexa
Everyday life shows part of the answer: programs recognize faces and unlock the smartphone, Siri and Alexa organize our daily life and cars drive (partially) autonomously. AI is a helpful, self-learning technique for assessing risks, organizing vast amounts of data, finding solutions, and making processes more efficient.
Organizing data or finding solutions is a significant advantage for the real estate industry, which generally produces vast amounts of data. But that requires intensive preparatory work.
Before a machine or a program is even able to learn by itself, these artificial helpers must first be “trained.” Before an application can automatically read and evaluate rental agreements, the system must first be programmed. The quality of the output, therefore, depends entirely on the input of the human operator.
The advantages can, therefore, be seen quickly. Europe seems to be more progressive in throwing cherished traditions overboard, provided that it serves to improve efficiency.
Currently, AI is mostly used in transactions for information management, such as for large real estate portfolios. In connection with a data room, all relevant information on the individual property or entire portfolios comes together and can, for example, be analyzed before a transaction.
Artificial intelligence as a real estate agent
Such analyzes require the collection of a lot of data — called Big Data. Suppose a sufficient amount of anonymized behavioral data is available. In that case, neural networks can predict with a very high degree of probability when, where, and at what price users of a web platform will rent or buy real estate.
Whether it’s a restored old building in the city center or a modern passive house in the country — these systems also know which type of property potential buyers are most likely to strike and can provide them with relevant offers.
An AI as a real estate agent? An experiment on the Denver real estate market shows that this works. For this purpose, a test candidate with an imaginary budget selected three objects from the urban area that he liked the most. Based on this information, three human real estate agents from Denver and an artificial intelligence sent him two further suggestions for buying property in Colorado’s capital.
As it turned out, the objects selected by the AI were most liked by the test candidate. The potential advantage for companies is that such systems can be used to address customers more precisely and provide them with relevant content.
AI in building automation
The built-in building technology in objects has been increasing steadily for years. That makes perfect sense. With IoT-enabled devices, sensors, and other technologies, real estate can be operated more efficiently and with less energy.
Also, the convenience of the user increases. However, this goes hand in hand with increasing complexity. To achieve maximum efficiency, it is, therefore, not enough to collect and evaluate the data. Because buildings are subject to various dynamic forces, such as the weather or a changing occupancy of rooms.
One possibility is to put the collected data in a temporal context. In this way, patterns of operation and use can be identified over hours, days, or months. In combination with building technology, artificial intelligence can recognize such trends. This enables operators to better predict certain developments, such as expected energy consumption.
Artificial intelligence in real estate management and real estate software solutions
The above approach to building automation can also be used in the area of property management. When is there a high probability of a need for renovation in which buildings? In which properties are high personnel costs to be expected in the coming quarter? Depending on the data collected, artificial intelligence solutions will make it easier to answer these questions about property management in the future.
Another possible application in this area is on the user’s side. An example: The tenant of an apartment detects damage in the property. With the help of a virtual assistant, she transmits information about the deficiency to facility management. An AI automatically processes the transmitted data to be used immediately by an employee for further processing.
Automation in building security
Neural networks are also increasingly being used for surveillance, as they — unlike a single security guard — can process an unlimited amount of video signals. Image processing systems recognize when a camera in the building is recording a movement and, in a matter of seconds, discuss whether it is a matter of people, animals, or an object.
If it is a person, facial recognition is used to determine whether they are in the monitored area without authorization. If this is the case, the porter will be informed. Still other systems recognize, for example, at airports, whether a person is carrying dangerous or prohibited objects. Shoplifters watch out: Artificial intelligence should now also be able to register suspicious behavior,
Conclusion
Before an artificial intelligence can independently recognize documents such as a building permit or a lease, goals must be defined first. The software is “trained” with the data on these goals. The advantages of artificial intelligence in the real estate sector are only fully exploited if the quality of the algorithms developed is right, so the input ultimately determines the quality of the output.
When developing analytics and algorithms to better understand a business target, unintended biases can sneak in that ensure desired outcomes are obtained. Guiding your work with multiple metrics in mind can help avoid such consequences of Goodhart’s Law.